Watch how to download trading robots for free
Find us on Twitter!
Join our fan page
Interesting script?
So post a link to it -
let others appraise it
You liked the script? Try it in the MetaTrader 5 terminal
Indicators

PTB - indicator for MetaTrader 5

Views:
5038
Rating:
(3)
Published:
2024.09.22 12:01
PTB.mq5 (12.44 KB) view
MQL5 Freelance Need a robot or indicator based on this code? Order it on Freelance Go to Freelance

Indicator Description: PTB.mq5


  • Overview:
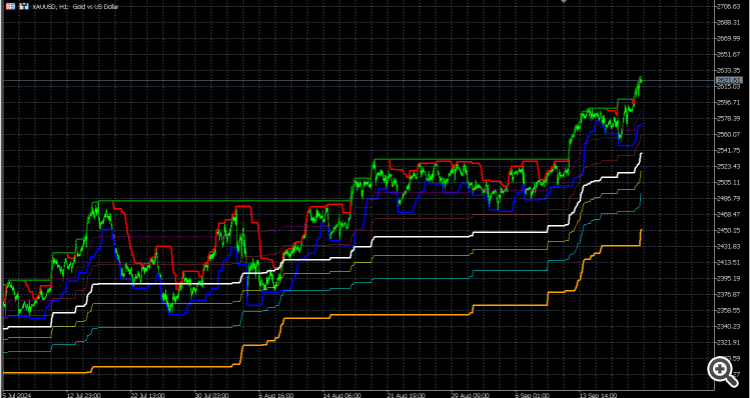
The PTB.mq5 indicator is designed for use in the MetaTrader 5 trading platform. It calculates and displays short-term and long-term high and low levels, along with Fibonacci retracement levels based on these extremes.
  • Features:
- Short-Term High and Low: The indicator computes the highest and lowest prices over a user-defined short length, which can help traders identify immediate support and resistance levels.
- Long-Term High and Low: It also calculates the highest and lowest prices over a longer period, providing insights into broader market trends.
- Fibonacci Levels: The indicator plots important Fibonacci retracement levels (23.6%, 38.2%, 50%, 61.8%, and 78.6%) based on the long-term high and low, which are widely used by traders to identify potential reversal points in the market.

  • Input Parameters:
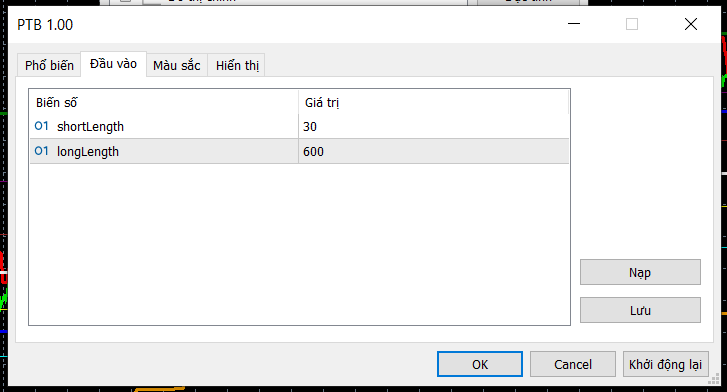
- shortLength: The number of candles to consider for calculating short-term high and low.
- longLength: The number of candles to consider for calculating long-term high and low.

  • Visual Representation:
- The indicator uses distinct colors and widths for different plotted lines:
  - Short High: Red (width: 3)
  - Short Low: Blue (width: 3)
  - Long High: Green (width: 3)
  - Long Low: Orange (width: 3)
  - Fibonacci Levels:   
    - 78.6%: Purple (width: 1)
    - 23.6%: Aqua (width: 1)
    - 38.2%: Yellow (width: 1)
    - 61.8%: Brown (width: 1)
    - 50%: White (width: 3)

  • Calculation Logic:
- The indicator iterates over the price data to compute the highest and lowest values for both short and long periods.
- It then calculates the Fibonacci levels based on the difference between the long-term high and low.


Code To Check And Delete Chart Objects For MT5 Code To Check And Delete Chart Objects For MT5

- The script scans through the current chart for any available chart objects, - Counts and delete them accordingly - And log the the names of the objects on the chart respectively.

ChartObjectsCopyPaste ChartObjectsCopyPaste

Copy and paste selected graphical objects between charts via Windows clipboard as text. Use Ctrl+Q on a source chart, then Ctrl+J on a target chart.

Logging V2 for both MQL4 and MQL5 Logging V2 for both MQL4 and MQL5

The CDebugLogger class is a flexible and comprehensive logging utility designed for use in MQL4/5 environments. It allows developers to log messages at various levels of importance (INFO, WARNING, ERROR, DEBUG) with options to include timestamps, function signatures, file names, and line numbers in the log entries. The class supports logging to both the console and files, with the ability to save logs in a common folder and in CSV format. Additionally, it offers functionality to silence logs based on specific keywords, ensuring that sensitive information is not logged. This class is ideal for developers looking to implement robust logging mechanisms in their MQL4/5 applications, with customizable features that cater to a wide range of debugging and monitoring needs.

Position Risk Calculation Tool Position Risk Calculation Tool

An indicator that dynamically calculates risk (in percentages and money) based on the lot size and stop loss