Join our fan page
- Views:
- 28699
- Rating:
- Published:
- 2010.01.26 11:25
- Updated:
- 2016.11.22 07:32
-
Need a robot or indicator based on this code? Order it on Freelance Go to Freelance
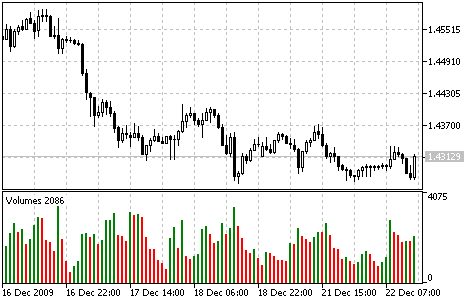
The Volumes indicator shows volumes with different colors depending on the volume changes.
The Indicator bars have two colors - green and red. The green color means that volume of the current bar is higher than volume of the previous bar. The red color, contrary, means that volume is lower than at previous bar. There is an option to choose the volumes used - tick/real volumes, the colors also can be changed.

Volumes indicator
Translated from Russian by MetaQuotes Ltd.
Original code: https://www.mql5.com/ru/code/52
 Ultimate Oscillator
The Ultimate Oscillator was developed by Larry Williams. It uses the averaging of three oscillators with different periods.
 Stochastic Oscillator
The Stochastic Oscillator compares where a security’s price closed relative to its price range over a given time period.
 Volume Rate of Change (VROC)
The Volume Rate of Change (VROC) is an indicator of the direction where the volume trend moves.
 Williams'Accumulation/Distribution (W_A/D)
The Williams' A/D indicator is the accumulated sum of positive "accumulational" and negative "distributional" price movements. Divergences between the indicator and the price are a signals.