Join our fan page
- Views:
- 8749
- Rating:
- Published:
- 2019.01.30 10:35
- Updated:
- 2019.01.30 10:35
-
 You are missing trading opportunities:
- Free trading apps
- Over 8,000 signals for copying
- Economic news for exploring financial markets
Registration Log inYou agree to website policy and terms of use
If you do not have an account, please register -
 Need a robot or indicator based on this code? Order it on Freelance
Go to Freelance
Need a robot or indicator based on this code? Order it on Freelance
Go to Freelance
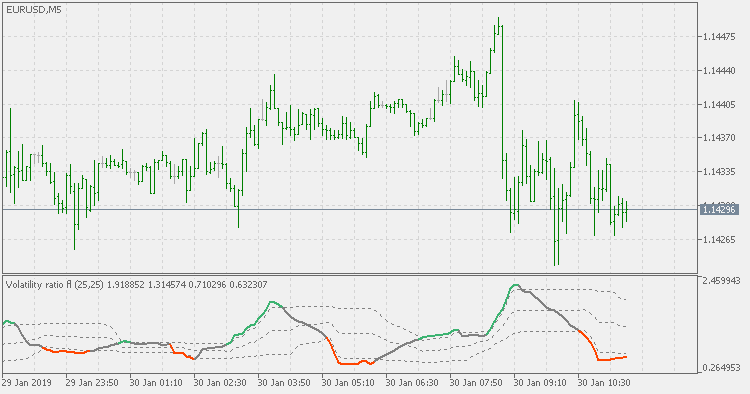
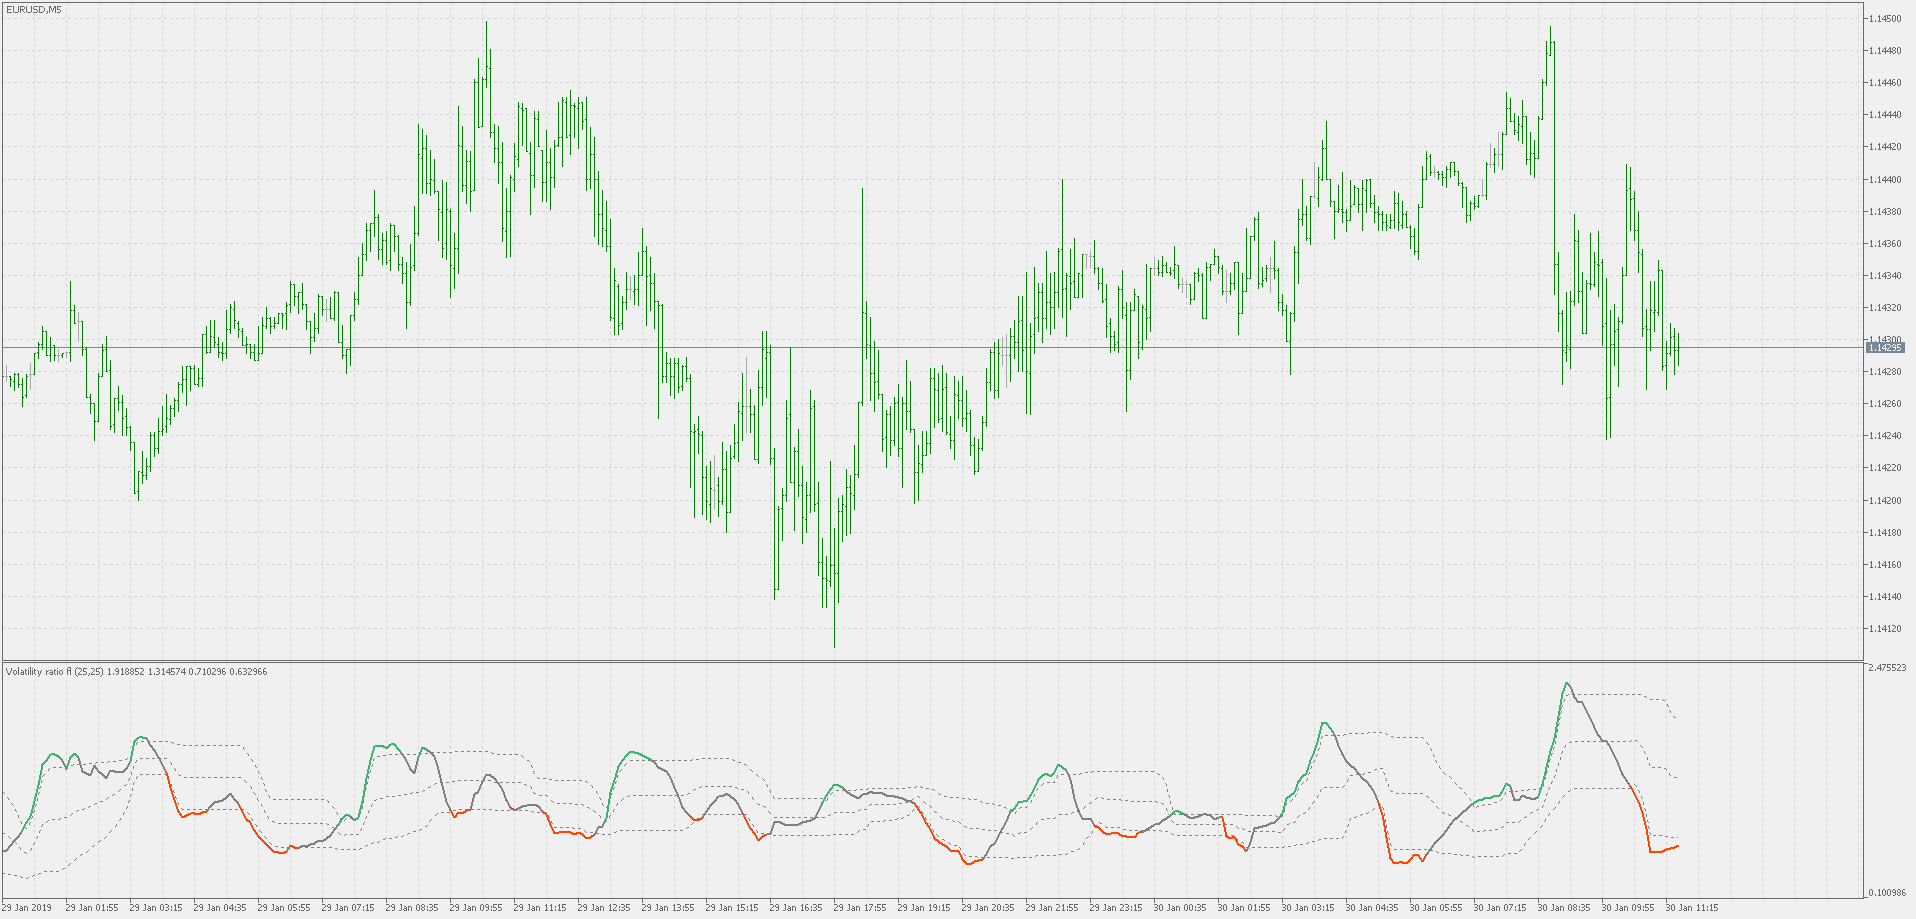
Theory :
There is always a need to measure if the market is "quiet" or it is
volatile. One of the possible way is to use standard deviations, but the
issue is simple : we do not have some levels that could help us find
out if the market is in a state of lower or higher volatility. This
indicator is attempting to do that but not by using fixed levels but adding floating (adaptive) levels. That way you have possible more states (including the "neutral" state) that can be checked and used in trading decisions
Usage :
This is not a directional indicator. It should be used for volatility detection, not trend assessment - for that you have to use some other indicator and then check this one if the market volatility conditions are those that you expect
 Volatility ratio
Volatility ratio - standard deviations based
Chande's DMI - std adaptive with floating levels
Chande's DMI - std adaptive with floating levels
RSX volatility ratio adaptive
RSX volatility ratio adaptive
Volatility ratio adaptive double smoothed Wilders EMA
Short description.