Join our fan page
- Views:
- 7598
- Rating:
- Published:
- 2018.11.26 18:30
-
 You are missing trading opportunities:
- Free trading apps
- Over 8,000 signals for copying
- Economic news for exploring financial markets
Registration Log inYou agree to website policy and terms of use
If you do not have an account, please register -
 Need a robot or indicator based on this code? Order it on Freelance
Go to Freelance
Need a robot or indicator based on this code? Order it on Freelance
Go to Freelance
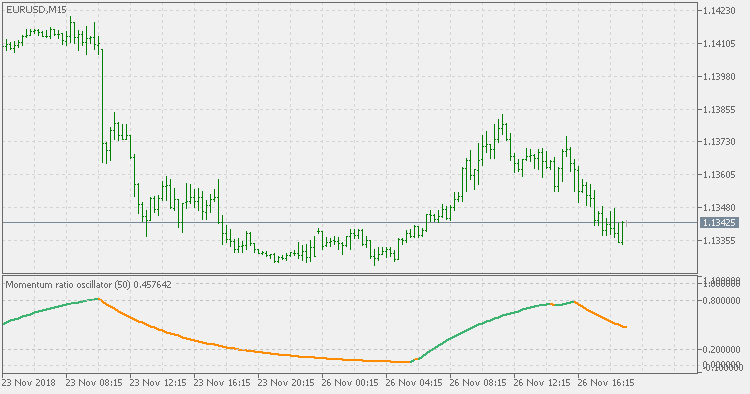
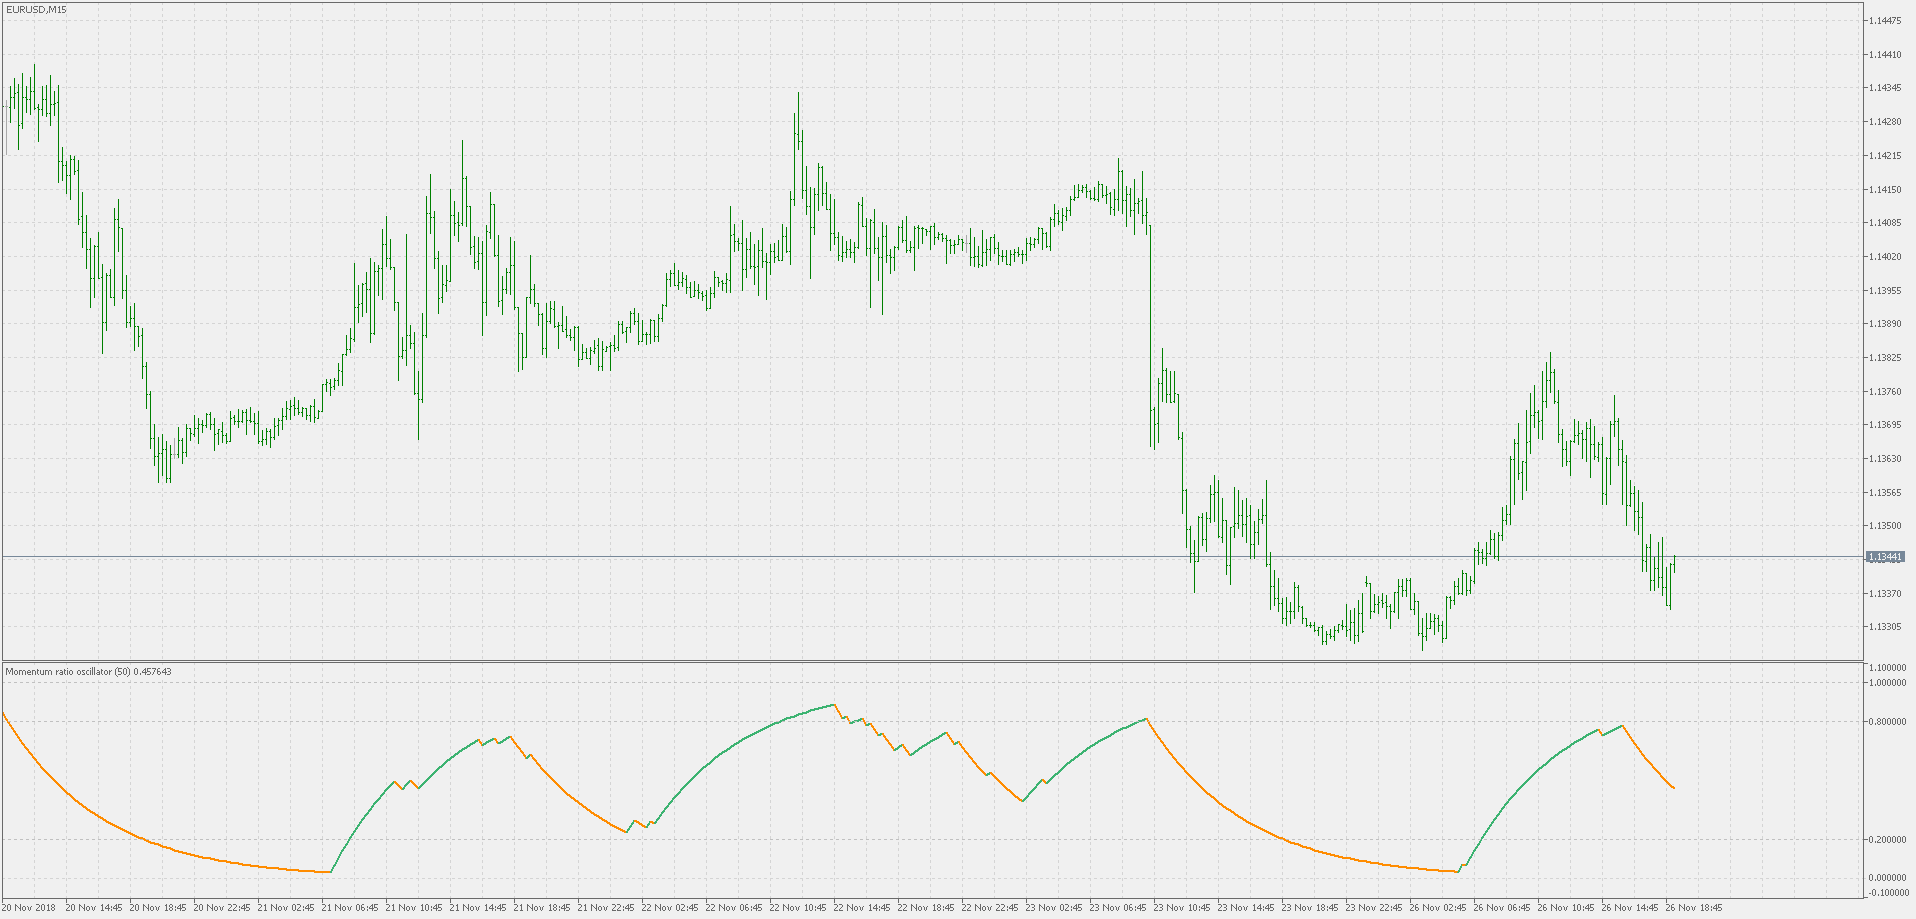
Theory :
The indicator is calculating a smoother value of momentum ratio (current value compare to previous value) using a series of ema calculations for smoothing. The result is a bit similar to some already existing indicators (like the volume zone or price zone oscillators), but that comes from the usage of the ema for smoothing (ema produces that "smooth step like" results when the values change suddenly) - the math used for those is completely different.
Usage :
In this version you can use either color changes or levels crosses (since the indicator is bound to 0 to 1 range) as signals
The "big picture" example :
 Highest high & lowest low support resistance
Highest high & lowest low support resistance
RSI divergence candles
RSI divergence candles
 Trade signal based on simple Bollinger bands
This is the trading signal of Bollinger Bands. The expert code for this strategy is automatically generated by the MQL 5 wizard.
EMA variation
Exponential moving average variation