Join our fan page
- Views:
- 8351
- Rating:
- Published:
- 2018.10.12 20:43
- Updated:
- 2019.01.29 14:37
-
 You are missing trading opportunities:
- Free trading apps
- Over 8,000 signals for copying
- Economic news for exploring financial markets
Registration Log inYou agree to website policy and terms of use
If you do not have an account, please register -
 Need a robot or indicator based on this code? Order it on Freelance
Go to Freelance
Need a robot or indicator based on this code? Order it on Freelance
Go to Freelance
Basics:
The Laguerre RSI indicator created by John F. Ehlers is described in his
book "Cybernetic Analysis for Stocks and Futures".
This version:
Instead
of using fixed periods for Laguerre RSI calculation it is using ATR
(average True Range) adapting method to adjust the calculation period.
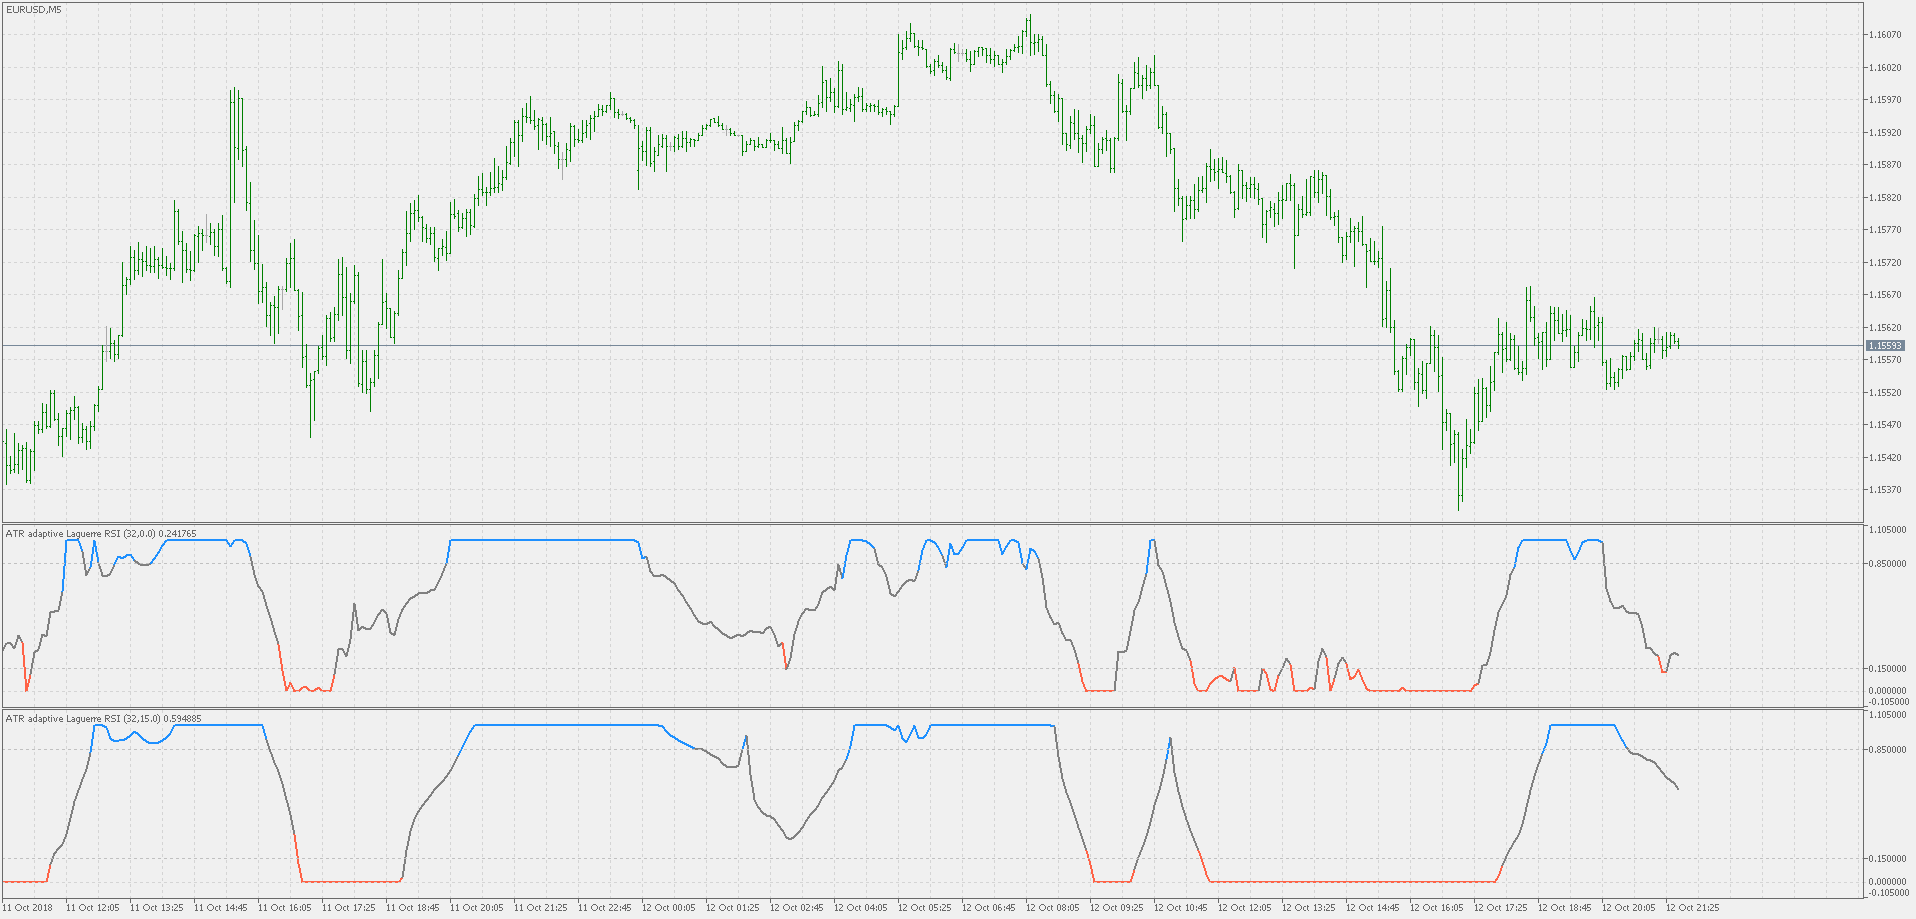
It makes the RSI more responsive in some periods (periods of high
volatility), and smoother in order periods (periods of low volatility). Also this version adds an option to have smoothed values. The smoothing method used is adding minimal lag (see the "big picture" example) and does not affect too much the result, but helps in making less signals, which will reduce false signals as a result.
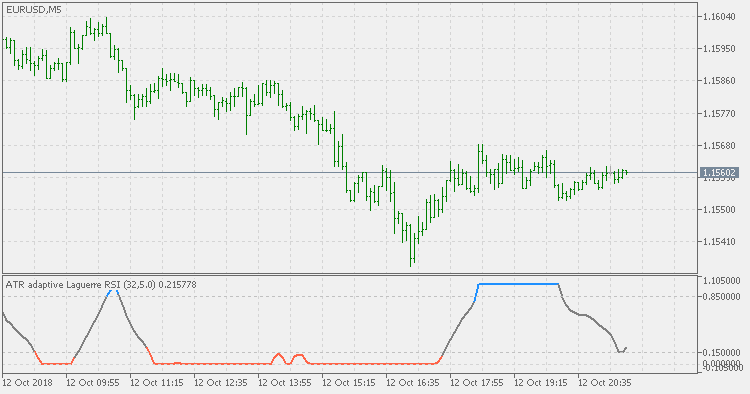
Usage:
You can use it (in combination with adjustable levels) for signals when color of the Laguerre RSI changes.
The "big picture" example:
Comparing the non-smoothed (upper) and what usually should produce significant lag (since the smoothing period used in the example is 15) and as it can be seen, the lag is all in all acceptable.
 ATR adaptive Laguerre RSI
ATR adaptive Laguerre RSI
Efficiency ratio directional with levels
Efficiency ratio directional with self adjusting levels
ATR adaptive smooth Laguerre RSI (dlvl)
ATR adaptive smooth Laguerre RSI with dynamic levels
Four clicks to draw an arc-shaped channel
A quick way to draw an arc-shaped channel in 4 mouse clicks.