Join our fan page
- Views:
- 12521
- Rating:
- Published:
- 2018.12.28 13:09
- Updated:
- 2019.01.17 11:29
-
 You are missing trading opportunities:
- Free trading apps
- Over 8,000 signals for copying
- Economic news for exploring financial markets
Registration Log inYou agree to website policy and terms of use
If you do not have an account, please register -
 Need a robot or indicator based on this code? Order it on Freelance
Go to Freelance
Need a robot or indicator based on this code? Order it on Freelance
Go to Freelance
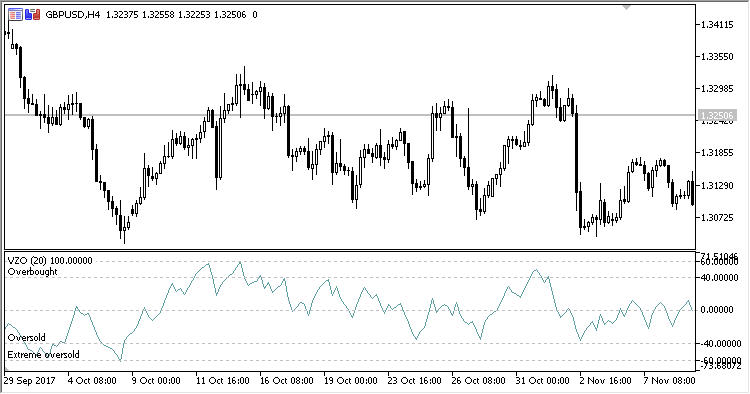
Oscillating indicator Volume Zone Oscillator (VZO) indicates volumes as related to the price change direction at each bar.
It has five adjustable parameters:
- Period - calculation period
- Extreme overbought - extreme overbought level
- Overbought - overbought level
- Oversold - oversold level
- Extreme oversold - extreme oversold level
Calculations:
VZO = (AvgVP / AvgVol) * 100.0
where:
AvgVol = EMA(Volume, Period)
AvgVP = EMA(VP, Period)
- If Close > PrevClose
VP = Volume
- otherwise
VP = -Volume
Volume - tick volume
The oscillator value of 40 or higher indicates the bullish accumulation. -40 and below are bearish accumulations. +/- 20 around zero indicate consolidation or approximity to a support/resistance level.
Where VZO is close to +/- 60, we should expect the end of the bullish/bearish movement. If this movement has been opposite to the long-term trend direction, the probability of a reversal is high.
Translated from Russian by MetaQuotes Ltd.
Original code: https://www.mql5.com/ru/code/22717
 NRTR_Revers
An EA based on indicator iATR (Average True Range, ATR)
 CandleMidPoint
Indicator Candle's Middle Point
RJTX_Matches_Smoothed_Alert_xx
Indicator RJTX_Matches_Smoothed_Alert featuring alerts, emails and push notifications for smartphones. The input variables allow replacing the displayed indicator symbols
RJTX_Matches_Smoothed_Alert
Indicator RJTX_Matches_Smoothed featuring alerts, emails and push notifications for smartphones