Join our fan page
- Views:
- 9046
- Rating:
- Published:
- 2018.12.28 13:09
- Updated:
- 2019.01.17 11:29
-
 You are missing trading opportunities:
- Free trading apps
- Over 8,000 signals for copying
- Economic news for exploring financial markets
Registration Log inYou agree to website policy and terms of use
If you do not have an account, please register -
 Need a robot or indicator based on this code? Order it on Freelance
Go to Freelance
Need a robot or indicator based on this code? Order it on Freelance
Go to Freelance
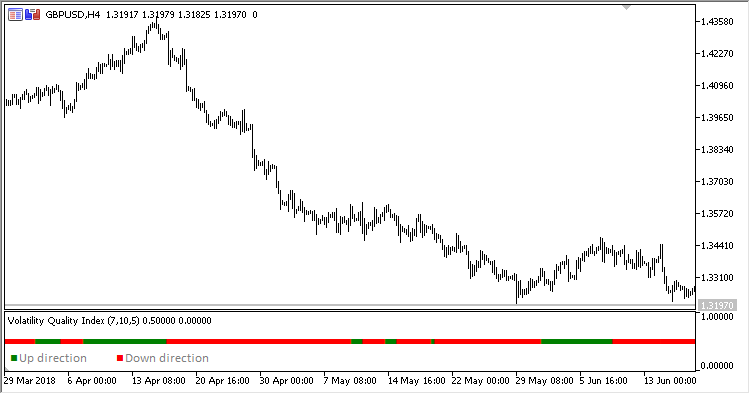
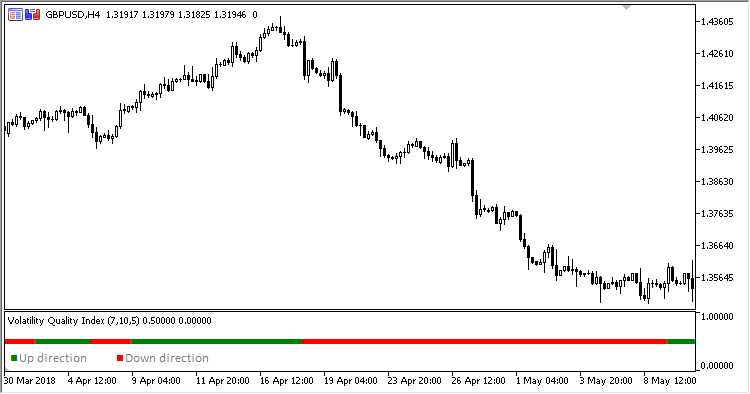
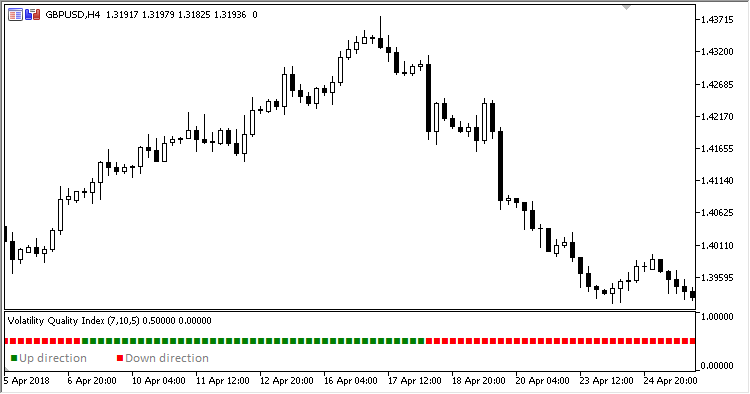
Trend-based informational signal indicator Volatility Quality Index displays the sections of up/down trends.
It has four adjustable parameters:
- Period - calculation period
- Method - calculation method
- Smoothing - smoothing period
- Filter - filter size
Calculations:
- If VQ > 0
The trend is up - a green signal pointer is placed
- Otherwise
The trend is down - a red signal pointer is placed
where:
- If (Abs(VQnew) < Filter
VQ = PrevVQ
- Otherwise
VQ = VQnew
VQnew = Abs(((Close - C2) / Max + (Close - Open) / (High - Low)) * 0.5) * ((Close - C2 + (Close - Open)) * 0.5)
Max = Maximum(High - Low, Maximum(High - C2, C2 - Low))
Open = MA(Open, Period, Method)
High = MA(High, Period, Method)
Low = MA(Low, Period, Method)
Close = MA(Close, Period, Method)
C2 = Close Smoothing bars ago
Translated from Russian by MetaQuotes Ltd.
Original code: https://www.mql5.com/ru/code/22699
 Extreme EA
Indicators iCCI (Commodity Channel Index, CCI) and two iMAs (Moving Average, MA) are used.
 Price_Momentum_Oscillator
Indicator Price Momentum Oscillator
Sylvain_Vervoort_RSI_inverse_fisher_transform
Indicator Sylvain Vervoort RSI inverse fisher transform
Sylvain_Vervoort_rainbow_moving_average
Indicator Sylvain Vervoort rainbow moving average