Join our fan page
- Views:
- 5618
- Rating:
- Published:
- 2018.09.27 16:11
-
 You are missing trading opportunities:
- Free trading apps
- Over 8,000 signals for copying
- Economic news for exploring financial markets
Registration Log inYou agree to website policy and terms of use
If you do not have an account, please register -
 Need a robot or indicator based on this code? Order it on Freelance
Go to Freelance
Need a robot or indicator based on this code? Order it on Freelance
Go to Freelance
Trendless OS DiNapoli was developed by Joe DiNapoli in 1980's and was described in his book "Trading with DiNapoli Levels". Like other his indicators, Trendless OS is an addition to the main decision-making tools - Fibonacci levels. Moreover, according to DiNapoli's concept, the Trendless indicator can be used as an independent trading tool. Individual level settings should be selected for each traded asset.
There are five inputs:
- Period - calculation period
- Applied price
- Overbought - overbought level
- Oversold - oversold level
- Drawing type - oscillator display type
- Line
- Histogram
Calculation:
TrendlessOS = Applied price – SMA(Applied price, Period)
Two additional display types are provided for the indicator: line (standard) and a color histogram, which shows bars in different colors depending on the position of the oscillator line relative to its levels. Two more levels are available in addition to the overbought and oversold levels: 0.6 and 0.8 of the value given in the settings.
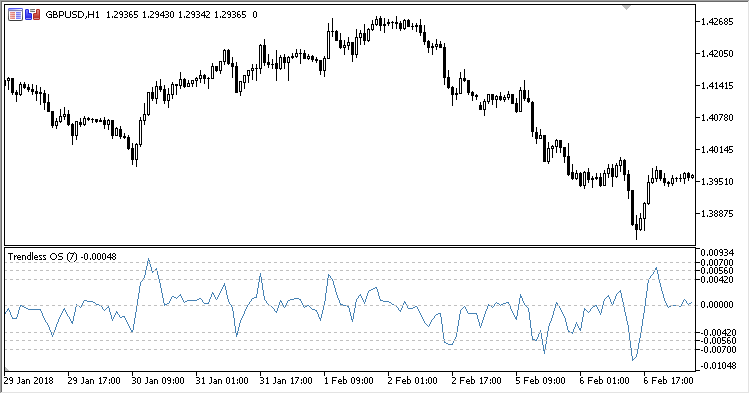
Fig. 1. Trendless OS - Drawing type = Line
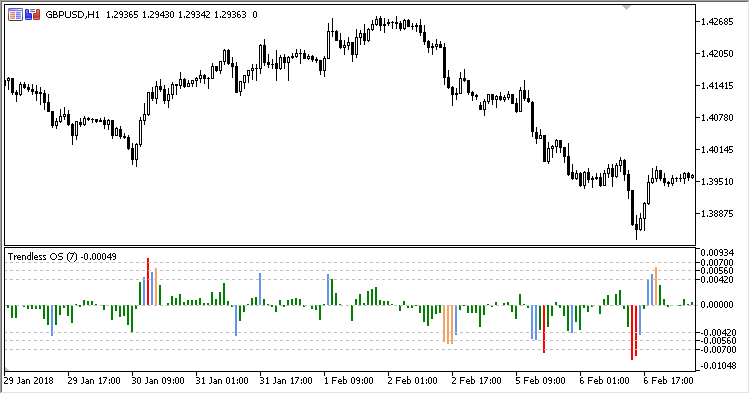
Fig. 2. Trendless OS - Drawing type = Histogram
Translated from Russian by MetaQuotes Ltd.
Original code: https://www.mql5.com/ru/code/21855
 Russian20-hp1
An Expert Advisor based on iMA (Moving Average, MA) and iMomentum (Momentum).
 LinearRegressionChannel_Cloud
The linear regression channel, which saves its values in the indicator buffers and fills the channel background with color
Valid_Swing_HighLow
The Valid Swing HighLow indicator
Volatility_Arbitrage
The Volatility Arbitrage indicator