Join our fan page
- Views:
- 3490
- Rating:
- Published:
- 2018.07.13 15:20
-
 You are missing trading opportunities:
- Free trading apps
- Over 8,000 signals for copying
- Economic news for exploring financial markets
Registration Log inYou agree to website policy and terms of use
If you do not have an account, please register -
 Need a robot or indicator based on this code? Order it on Freelance
Go to Freelance
Need a robot or indicator based on this code? Order it on Freelance
Go to Freelance
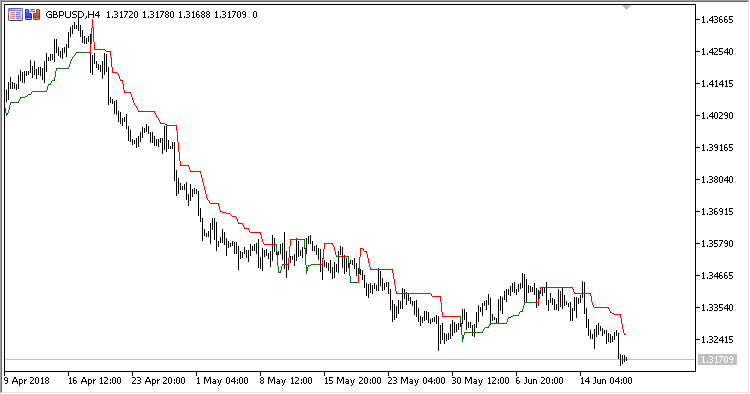
Trend-following indicator LeManStop is a representative of system LeMan and displays Stop Loss levels for the existing positions in the chart. It draws two Stop Loss lines for Long and Short positions, displayed in different colors.
It has six configurable parameters:
- Period - calculation period;
- Coefficient - coefficient of stop line deviation from the price;
- Fast MA period - fast moving average calculation period;
- Fast MA method - fast moving average calculation method;
- Slow MA period - slow moving average calculation period;
- Slow MA method - slow moving average calculation method.
Calculations:
If dMA > 0:
LeMan Stop = PrevOpen - Coeff * SMA(HO, Period)
If dMA < 0:
LeMan Stop = PrevOpen + Coeff * SMA(OL, Period)
where:
HO = High - Open
OL = Open - Low
dMA = FastMA - SlowMA
FastMA - MA(Close, Fast MA period, Fast MA method)
SlowMA - MA(Close, Slow MA period, Slow MA method)
Translated from Russian by MetaQuotes Ltd.
Original code: https://www.mql5.com/ru/code/21163
 GB
GB
Indicator GB (Gaussian Bands) works in the same manner as standard indicator Bollinger Bands. However, unlike the former, it performs filtering centerline and deviation lines by Gaussian method. It also has two deviation lines on each side of the centerline.
DMX
Indicator DMX (Bipolar DMI) is calculated using the standard indicator ADX. However, as compared to that, it displays data as an oscillator with a signal line, and has shorter delay.
MPO
Indicator MPO (Midpoint Oscillator) displays price movement without its trend component around its centerpoint. It is displayed as two lines: Price movement line and signal line. Centerline (MidPoint) is zero level of the oscillator.
PVO
Indicator PVO (Percentage Volume Oscillator) represents a momentum for the volume. It calculates the difference in the percents of large MA between two moving averages based on volumes.