Join our fan page
- Views:
- 4166
- Rating:
- Published:
-
Need a robot or indicator based on this code? Order it on Freelance Go to Freelance
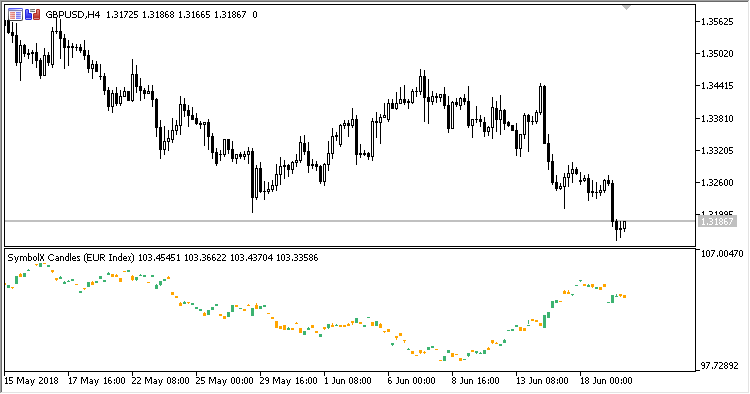
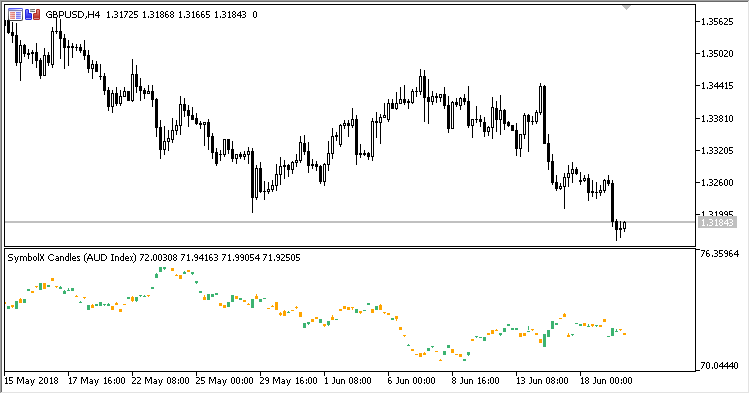
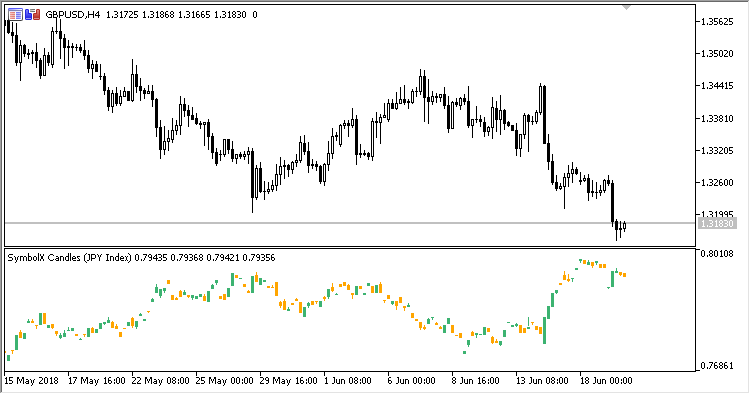
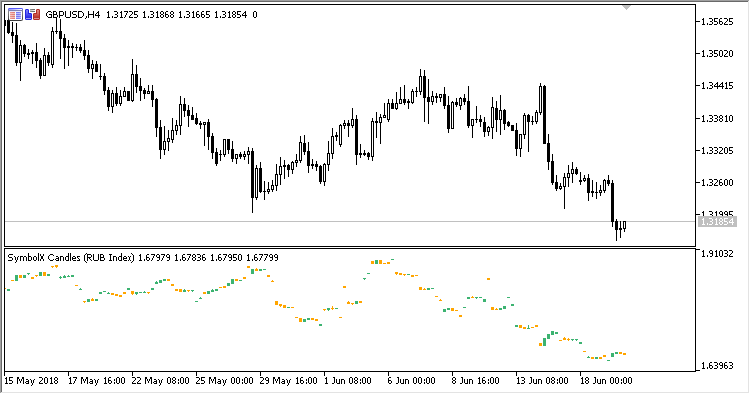
This indicator calculates the index of a given currency, using the USD index. It is based on indicator SymbolX, but four prices are used for calculations: OHLC instead of just one Close price.
For example:
- EUR index is calculated as (EUR / USD) * USDX;
- CHF index is calculated as USDX / (USD / CHF).
The indicator has to configurable inputs:
- Instrument - name of the instrument, the index of which shall be calculated;
- Invert the graph - invert the indicator graph.
It should be noted that six currency pairs are used for calculating the index, namely: EURUSD, USDJPY, GBPUSD, USDCAD, USDSEK, and USDCHF; and all the necessary history for those symbols must be additionally loaded to get a correct display. This will require some time. It means that, at the first running or switching the chart timeframe, the indicator will first load history and only then calculate and display the index for your desired currency.
The indicator works on the charts of any currency pairs.

Fig 1. SymbolX_Candle index EUR

Fig. 2. SymbolX_Candle index AUD

Fig. 3. SymbolX_Candle index JPY

Fig. 4. SymbolX_Candle index RUB
Translated from Russian by MetaQuotes Ltd.
Original code: https://www.mql5.com/ru/code/21158
 SymbolX
This indicator calculates the index of a given currency, using the USD index. The Close prices of six currency pairs are used to calculate the index.
 Ang_Zad_C_Hist_Candle
A candlestick-based chart based on histograms Ang_Zad_C_Hist calculated on the Open, High, Low, and Close timeseries of the price chart.
 ASO
ASO
Indicator ASO (Average Sentiment Oscillator) displays the general market climate.
 CA
CA
Indicator CA (Corrected Average), also known as Optimal Moving Average. The benefit of the indicator is the fact that the current value of the timeseries must exceed the current threshold that depends on volatility for the indicator line to follow the price, avoiding false signals in the trend.