Join our fan page
- Views:
- 7008
- Rating:
- Published:
- 2018.06.01 11:41
-
 You are missing trading opportunities:
- Free trading apps
- Over 8,000 signals for copying
- Economic news for exploring financial markets
Registration Log inYou agree to website policy and terms of use
If you do not have an account, please register -
 Need a robot or indicator based on this code? Order it on Freelance
Go to Freelance
Need a robot or indicator based on this code? Order it on Freelance
Go to Freelance
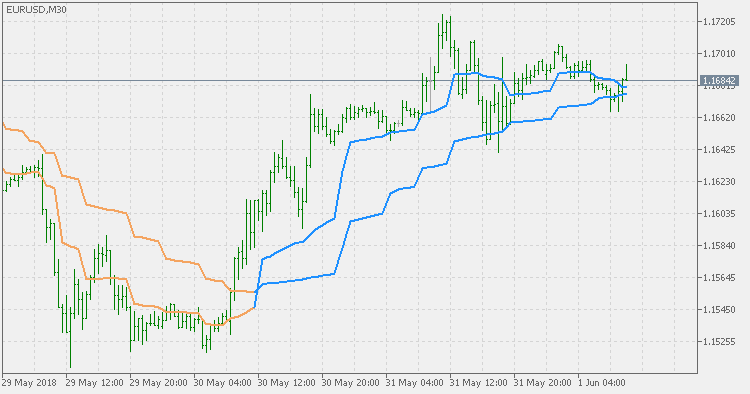
The MESA Adaptive Moving Average (MAMA) and the Following Adaptive Moving Average (FAMA) combination (originally published here MAMA + FAMA) made to be multi timeframe.
Timeframes supported are all the possible timeframes supported by MetaTrader 5 and it has 3 "special" timeframes:
- Next higher timeframe: first higher timeframe compared to active chart.
- Second higher timeframe: second higher timeframe compared to active chart.
- Third higher timeframe: third higher timeframe compared to active chart.
If some of these 3 timeframes are used, then the timeframe is set automatically as you change the timeframe of the chart.
PS: the indicator is a stand-alone indicator - it does not need the "regular" version in order to work, neither it uses any other indicator.
PPS: one more explanation (for cases when people expect the indicator to be applied to some other indicator) - in cases when the indicator should be applied to some other indicator, that indicator can not be multi timeframe (or some other types of customizing) simply because it entirely depends on the target data. Hence these indicators are not made to be applied to other indicators - to keep the flexibility we have with the choice of timeframes data intact.
 MAMA + FAMA Oscillator
Combination of MAMA (MESA Adaptive Moving Average) and FAMA (Following Adaptive Moving Average) made as an oscillator.
MAMA + FAMA
This indicator uses the combined values of MAMA (MESA Adaptive Moving Average) and FAMA (Following Adaptive Moving Average) to assess the trend of the market.
