Join our fan page
- Views:
- 24714
- Rating:
- Published:
- 2018.05.07 14:56
-
 You are missing trading opportunities:
- Free trading apps
- Over 8,000 signals for copying
- Economic news for exploring financial markets
Registration Log inYou agree to website policy and terms of use
If you do not have an account, please register -
 Need a robot or indicator based on this code? Order it on Freelance
Go to Freelance
Need a robot or indicator based on this code? Order it on Freelance
Go to Freelance
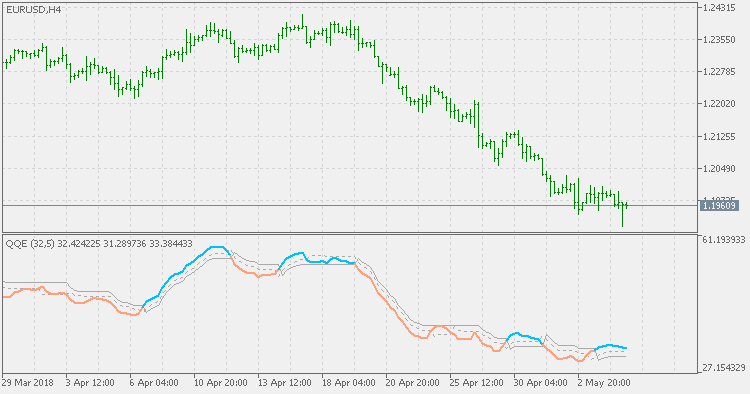
The QQE (Quantitative Qualitative Estimator) indicator consists of a smoothed Relative Strength Index (RSI) indicator and two volatility-based trailing levels (fast and slow).
The Fast Trailing Level (TL) and Slow TL are constructed by calculating the average range of the smoothed RSI over n-periods and then further smoothing the average range using an additional n-periods Wilders smoothing function. This smoothed average range of RSI is then multiplied by the Fast and Slow average range Multipliers to calculate the final Fast and Slow Trailing Levels.
 Swing Line - Histogram
Ron Black's Swing Line indicator made as histogram indicator.
Swing Line (adjusted display)
Ron Black's swing line indicator with adjusted display option.
TWR
TWR is an indicator of a trend reversal.
Dynamic Balance Point - Support & Resistance
Based on the original Dynamic Balance Point, this version is a bit cleaner and simpler to use indicator.