Join our fan page
- Views:
- 5872
- Rating:
- Published:
- 2018.05.02 17:23
-
 You are missing trading opportunities:
- Free trading apps
- Over 8,000 signals for copying
- Economic news for exploring financial markets
Registration Log inYou agree to website policy and terms of use
If you do not have an account, please register -
 Need a robot or indicator based on this code? Order it on Freelance
Go to Freelance
Need a robot or indicator based on this code? Order it on Freelance
Go to Freelance
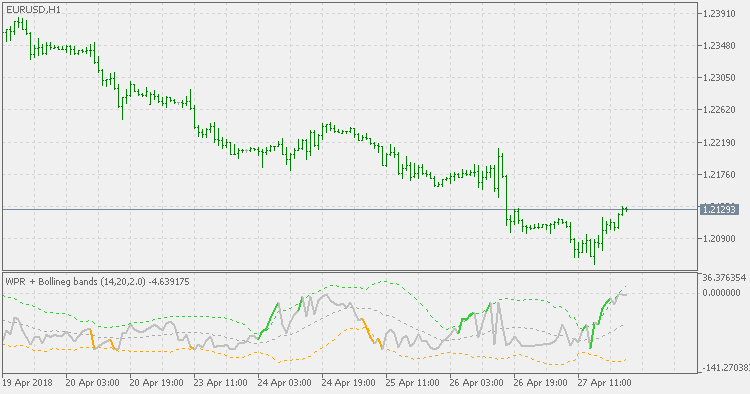
Williams %R, WPR, or just %R, is a technical analysis oscillator showing the current closing price in relation to the high and low of the past N days (for a given N). It was developed by a publisher and promoter of trading materials, Larry Williams. Its purpose is to tell whether a stock or commodity market is trading near the high or the low, or somewhere in between, of its recent trading range.
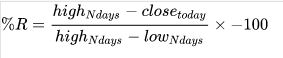
The oscillator is on a negative scale, from −100 (lowest) up to 0 (highest), obverse of the more common 0 to 100 scale found in many Technical Analysis oscillators. A value of −100 means the close today was the lowest low of the past N days, and 0 means today's close was the highest high of the past N days. (Although sometimes the %R is adjusted by adding 100.)
This version of Williams Percent Range has an addition of Bollinger bands to help identify possible overbought and oversold levels breaks.
 Count Back Lines
Indicator based on the Daryl Guppy's original strategy.
Volatility Bands Percent
This is the version that David Rooke proposes as a solution to Bollinger Bands issues in a percent representation.
Dynamic Pivots
Based on the Austin Passamonte's idea, this indicator calculates intra-day pivots.
Vortex - smoothed
Vortex indicator (based on the article that was published in the January 2010 issue of TASC) with a smoothing option.