Watch how to download trading robots for free
Find us on Twitter!
Join our fan page
Join our fan page
You liked the script? Try it in the MetaTrader 5 terminal

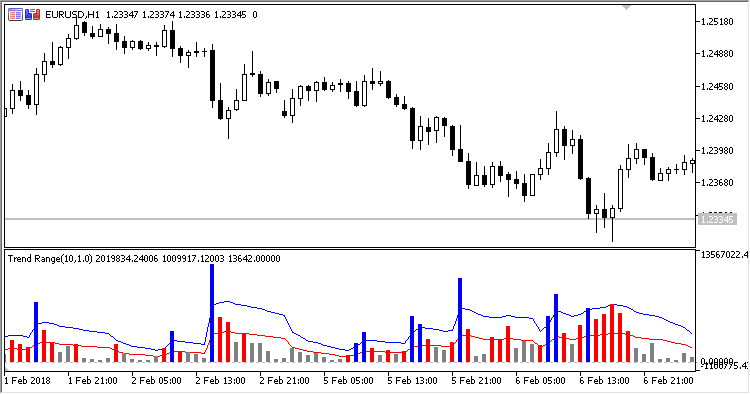
Trend Range - indicator for MetaTrader 5
- Views:
- 11382
- Rating:
- Published:
-
 You are missing trading opportunities:
- Free trading apps
- Over 8,000 signals for copying
- Economic news for exploring financial markets
Registration Log inYou agree to website policy and terms of use
If you do not have an account, please register -
 Need a robot or indicator based on this code? Order it on Freelance
Go to Freelance
Need a robot or indicator based on this code? Order it on Freelance
Go to Freelance
The oscillator indicator draws a histogram (with border levels at two moving averages on the indicator histogram) showing three market states: a trend, a moderate or fading trend and a flat.
- If the histogram bar (blue) is above the upper level (blue line), then there is a strong movement in the market;
- If the histogram bar (red) is between the upper and lower levels (between the blue and red lines), then there is either a moderate or fading trend;
- If the histogram bar (gray) is below the lower level (below the red line), then the market movement is weak and flat.
The indicator has three input parameters:
- Period - calculation period;
- Method - smoothing method;
- Deviation - deviation for the calculation of threshold levels.
Translated from Russian by MetaQuotes Ltd.
Original code: https://www.mql5.com/ru/code/20156
GapFinder
Gap searching indicator.
SZO
SZO (Sentiment Zone Oscillator) is an indicator of market sentiment, which has overbought and oversold zones.
CCI_Dots
The indicator adds signal marks to a price chart when the CCI indicator crosses its zero line.
HL_MA_Band
A colored histogram drawn using the High/Low prices.