Join our fan page

Simple oscillator showing the difference between two Moving Averages - indicator for MetaTrader 5
- Views:
- 4864
- Rating:
- Published:
-
 You are missing trading opportunities:
- Free trading apps
- Over 8,000 signals for copying
- Economic news for exploring financial markets
Registration Log inYou agree to website policy and terms of use
If you do not have an account, please register -
 Need a robot or indicator based on this code? Order it on Freelance
Go to Freelance
Need a robot or indicator based on this code? Order it on Freelance
Go to Freelance
A simple oscillator. Shows the difference between two exponential Moving Averages in the form of a colored histogram drawn in a separate window.
There are three adjustable parameters:
- Period EMA - periods of moving averages;
- Shift of the second EMA - shift for the second EMA in bars (if 0, the value of 1 is used);
- Threshold - the threshold value. If the histogram bar value is greater than the specified value, the bar is green (default). It the bar is less than the threshold, it is shown in red. If it is within +/- Threshold, the bar is yellow.
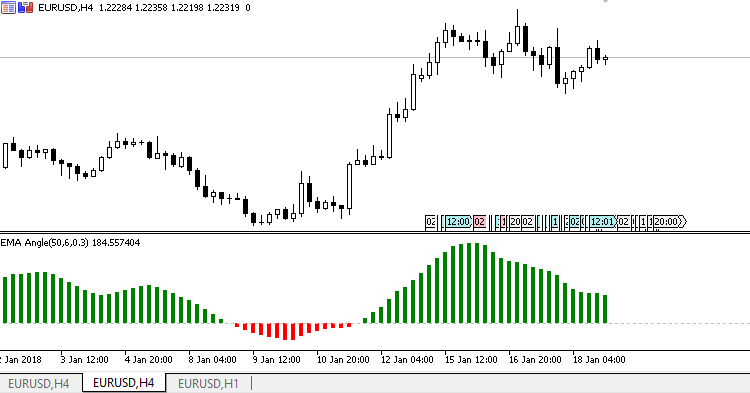
Fig.1 Default values.

Fig.2 Threshold 50.
Translated from Russian by MetaQuotes Ltd.
Original code: https://www.mql5.com/ru/code/19785
Marking of candlesticks larger than the specified size
The indicator marks on a price chart candlesticks, which are larger than the specified size. If the candlestick size exceeds the value specified in the indicator parameters, the indicator can show an alert message.
Advanced Fractals
Unlike the standard Fractals, this indicator allows searching and displaying on a chart fractals with the user defined dimensions.
Custom Daily Candlesticks
The indicator draws daily candlesticks with extended parameters. It only works on the D1 chart timeframe.
Channel based on extreme prices
The indicator draws a channel at candlestick extreme prices.