Join our fan page
- Views:
- 4125
- Rating:
- Published:
- 2018.03.01 09:32
- Updated:
- 2023.03.29 13:48
-
Need a robot or indicator based on this code? Order it on Freelance Go to Freelance
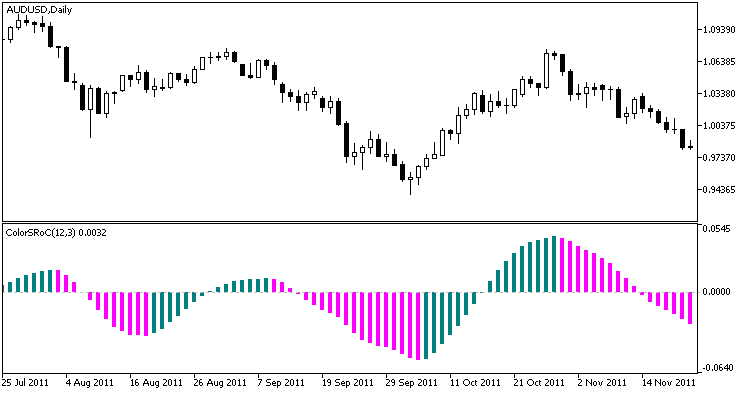
The smoothed S-RoC indicator of the relative price increment by Fred Shutsman.
The indicator is calculated using the next formula:
where
- EMA [bar] is the EMA value on the current bar;
- EMA[bar - Roc] is the value of the same EMA in the past at a distance of Roc period from the current bar.
The indicator uses SmoothAlgorithms.mqh library classes (copy it to <terminal_data_folder>\MQL5\Include). The detailed description of the classes is available in the article Averaging Price Series for Intermediate Calculations Without Using Additional Buffers.

Fig.1. The ColorSRoC indicator
Translated from Russian by MetaQuotes Ltd.
Original code: https://www.mql5.com/ru/code/19631
 Cointegration
The indicator calculates and displays a linear relationship between two or more financial symbols.
 RMI_Histogram
Relative Momentum Index implemented as a color histogram with an indication of overbought and oversold zones.
 JS_SISTEM_2
The Expert Advisor uses three iMAs (Moving Average, MA), one iOsMA (Moving Average of Oscillator and one iRVI (Relative Vigor Index, RVI). Trailing stop is based on the High/Low of earlier bars.
 Martin for small deposits
Martingale based Expert Advisor specially designed for small deposits.