Join our fan page
- Views:
- 3485
- Rating:
- Published:
- 2018.01.22 09:21
-
Need a robot or indicator based on this code? Order it on Freelance Go to Freelance
Real author: Mohit Marwaha
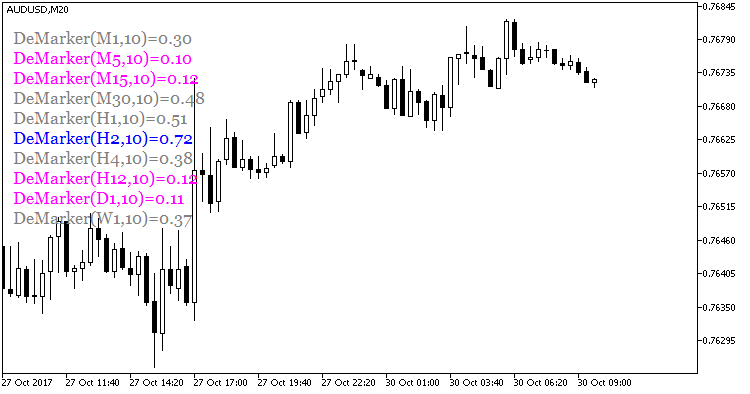
The indicator shows a text block with the values of the user defined DeMarker oscillator period for each timeframe. The size of the text block is customizable. You can also change the text font and disable the display of unused timeframes. The maximum number of simultaneously displayed indicators is ten. The color of the text block depends on the position of the DeMarker indicator relative to overbought and oversold zones, which are set in the indicator input parameters
input double HighLevel=0.70;                            // overbought level
input double LowLevel=0.30;                             // oversold level
input color HighColor=clrBlue;                          // overbought color
input color MiddleColor=clrGray;                        // no-trend color
input color LowColor=clrMagenta;                        // oversold color

Fig.1. The DeMarkerValues indicator
Translated from Russian by MetaQuotes Ltd.
Original code: https://www.mql5.com/ru/code/19322
 WPRValues
The indicator shows a text block with the values of the user defined WRP oscillator period for each timeframe.
 Statistics of candles
Counting the number of series of bullish and bearish bars. Displaying the result as a chart. Saving the screenshot of the resulting chart. The script uses the CGraphic class.
 Statistics of candles 2
Counting the number of series of bullish and bearish bars. Displaying the result as a chart. Saving the screenshot of the resulting chart. The script uses the CGraphic class.
 Count of candles in interval (histogram)
The indicator shows the number of bullish and bearish bars in the given interval.