Join our fan page
- Views:
- 4939
- Rating:
- Published:
- 2016.09.19 12:53
- Updated:
- 2023.03.29 13:47
-
Need a robot or indicator based on this code? Order it on Freelance Go to Freelance
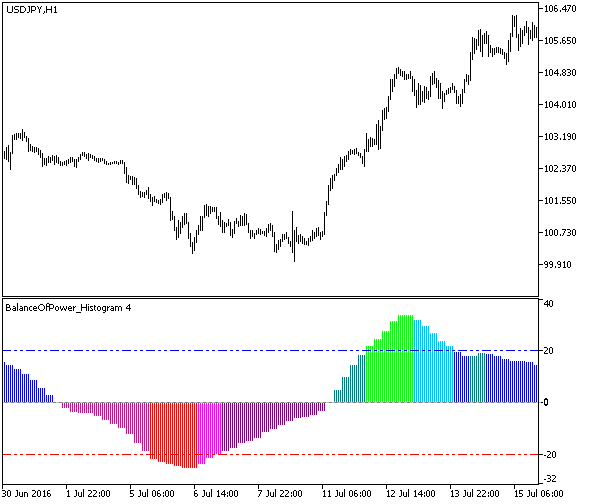
The BalanceOfPower_Histogram indicator with the timeframe selection option available in the input parameters:
input ENUM_TIMEFRAMES TimeFrame=PERIOD_H4; // Indicator chart period (timeframe)
The indicator requires BalanceOfPower_Histogram.mq5 indicator file. Place it in <terminal_data_folder>\MQL5\Indicators.

Fig.1. The BalanceOfPower_Histogram_HTF indicator
Translated from Russian by MetaQuotes Ltd.
Original code: https://www.mql5.com/ru/code/16213
 RSICandleV2
The RSI indicator implemented as candlesticks with indication of breaking the overbought and oversold areas.
 FloatPivot_Digit
The FloatPivot indicator with the color filling inside the channel, drawn as a cloud, with the display of the last values as price labels and the possibility to round the channel levels up to a required number of digits.
 Exp_BalanceOfPower_Histogram
The Exp_BalanceOfPower_Histogram Expert Advisor is based on change of direction of the BalanceOfPower_Histogram indicator.
 Exp_i-SpectrAnalysis_Chaikin
The Exp_i-SpectrAnalysis_Chaikin Expert Advisor is based on change of direction of the i-SpectrAnalysis_Chaikin indicator.