Join our fan page
- Views:
- 13755
- Rating:
- Published:
- 2016.10.10 15:29
-
Need a robot or indicator based on this code? Order it on Freelance Go to Freelance
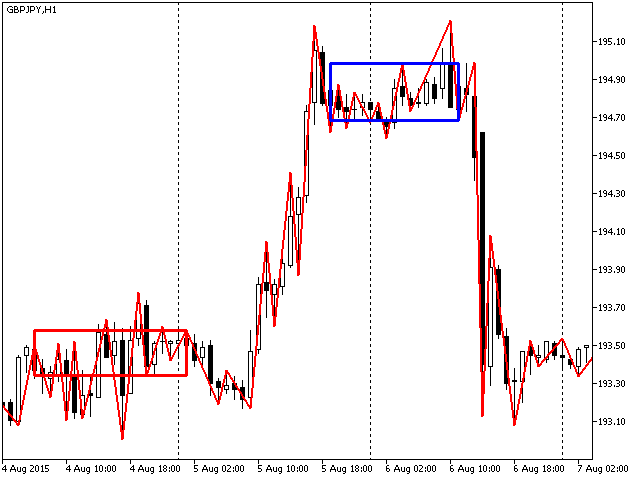
More experiments with the Simple ZigZag indicator. A small upgrade allows the indicator to find and mark the price consolidation areas with colored rectangles.
The Simple ZigZag indicator is the development of an idea of automated visualization of technical analysis. We have started with a simple indicator Simple ZigZag that plots local Highs and Lows on a chart. Our task now is to learn to recognize different patterns of technical analysis using the above indicator.
The proposed indicator searches for flat consolidation zones on a price chart.
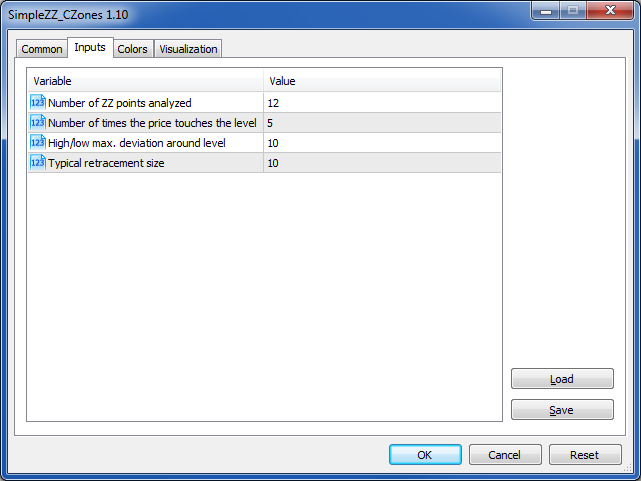
The number of highs/lows required for constructing a zone, the total number of analyzed zigzag points, and the accuracy of matching of extrema are defined by the three parameters of the indicator:
- Number of times the price touches the level.
- Number of ZZ points analyzed.
- High/low max. deviation around level.
The fourth parameter - Typical retracement size - is inherited from the parent indicator (Simple ZigZag).

The areas where several highs make up a line in the upper part of the zone are marked in red; the areas where several lows make up a line in the lower part of the zone are marked in blue. As for now, the indicator cannot be built into an Expert Advisor, because it doesn't have appropriate buffers for the area borders (expected later). We will further continue to complicate the recognized patters, and will adapt the indicator for use in automated trading systems.

Translated from Russian by MetaQuotes Ltd.
Original code: https://www.mql5.com/ru/code/15992
 yEffekt_HTF
The yEffekt indicator with the timeframe selection option available in input parameters.
 i-CAi_StDev
The i-CAi indicator with additional trend strength indication using colored dots based on the standard deviation algorithm.
 i-CAi_StDev_HTF
The i-CAi_StDev indicator with the timeframe selection option available in input parameters.
 AutoGannAutoTrend
The indicator plots price channel, Fibonacci levels and Gann fan based on the latest ZigZag peaks.