Watch how to download trading robots for free
Find us on Telegram!
Join our fan page
Join our fan page
You liked the script? Try it in the MetaTrader 5 terminal
- Views:
- 21333
- Rating:
- Published:
- 2015.07.29 11:15
- Updated:
- 2016.11.22 07:32
-
Need a robot or indicator based on this code? Order it on Freelance Go to Freelance
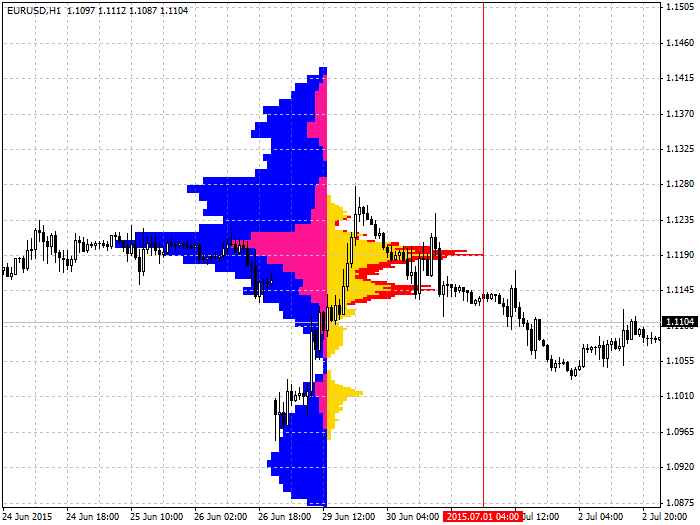
This indicator shows four price histograms when a click event is fired.
Personally, I made it for the check at the time of development, but it was shared.
Updates (30/07/2015):
v 1.01
- Eliminated bugs due to the InpCalcTime does not work.
- Changed the BinRangeScale from 6 to 4.
v 1.02
- A large bug was found. Please use here.
before:
   calc_histgram(lt_vh,lt_vhZO,m30high,m30low,m30vol,offset,limit,InpBinRange*8,lt_period);
   calc_histgram(mt_vh,mt_vhZO,m30high,m30low,m30vol,offset,limit,InpBinRange*8,mt_period);

after:
   calc_histgram(lt_vh,lt_vhZO,m30high,m30low,m30vol,offset,limit,InpBinRange*BinRangeScale,lt_period);
   calc_histgram(mt_vh,mt_vhZO,m30high,m30low,m30vol,offset,limit,InpBinRange*BinRangeScale,mt_period);

...it is my stupid error.
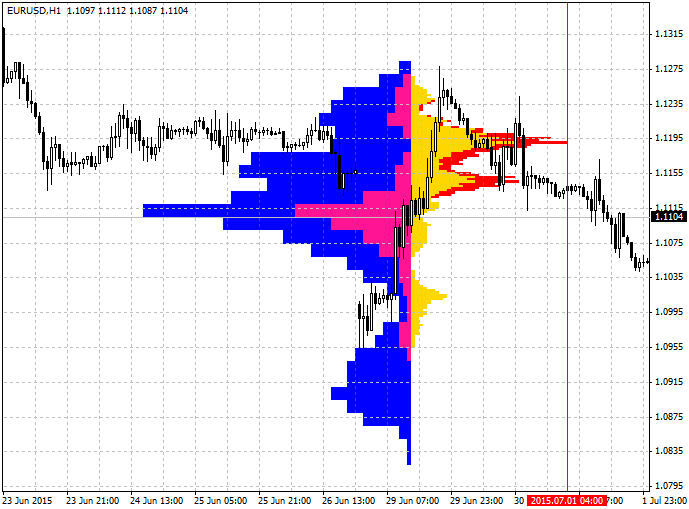
Display:
- Red — 1-day histogram (use M5 timeframe).
- Gold — short term histogram (use M5 timeframe).
- Pink — medium term histogram (use M30 timeframe).
- Blue — long term histogram (use M30 timeframe).
This is new version (v1.02)

This is old version (v1.00)

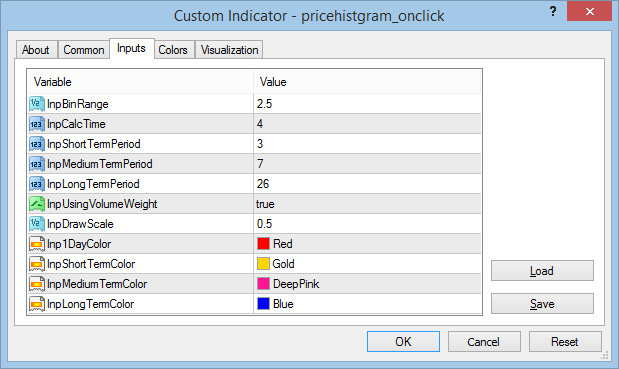
Settings:

 News Hour Trade
Expert Advisor I have developed for News Time Trading (set time and leave it).
 Hull Moving Average
The Hull Moving Average (HMA) is an extremely fast and smooth Moving Average that almost eliminates lag altogether and manages to improve smoothing at the same time.
 DXWeekSnR
Indicator of support and resistance levels based on Open Close High Low Weekly Candle.
 PriceHistogram Channel
This indicator shows channels using the price histogram.