Join our fan page
- Views:
- 29574
- Rating:
- Published:
- Updated:
-
Need a robot or indicator based on this code? Order it on Freelance Go to Freelance
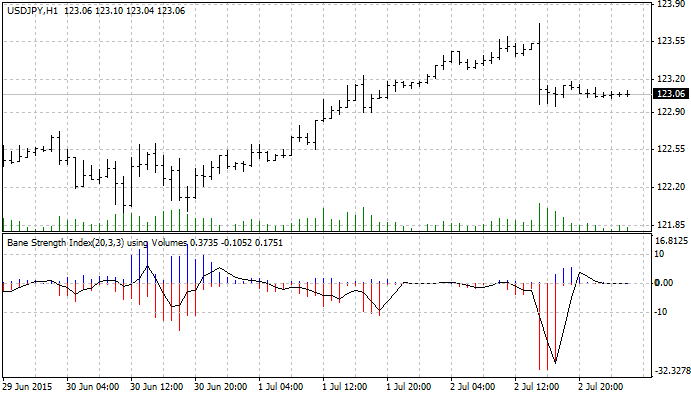
Bounce Strength Indicator (BSI) shows the strength of bounce according to the Wyckoff method.
After a move higher, the stock moves into a flat consolidation with a clear support level. Chartists should watch action closely as prices approach support. A high volume surge off support, also known as a springboard, is the first sign that the bigger uptrend is set to continue and a consolidation breakout is imminent.
How to measure the strength of bounce?
Strength of bounce up from lows:
(close - low ) * ( ceiling - low ) / range spread
Strength of bounce down from highs:
(high - close) * ( high - floor ) / range spread
My measuring method means the following:
- The greater the rise from lower position, the stronger the buying pressure.
- The greater the fall from higher position, the stronger the selling pressure.
This idea is simple, but it can become a leading indicator of the range breakout. It will work only within range.
- plus histogram — shows the bounce strength up from lows;
- minus histogram — shows the bounce strength down from highs;
- middle line — average of difference between plus/minus.

 Check Current Open Orders With Profit
This script lists current open orders with profit.
 Guppy (Long and Short)
This indicator combines two groups of six exponential moving averages of different periods to elucidate the direction and the strength of the short-term and long-term trend.
 Reversal Navi
Reversal Navi indicator shows the entry point coming after the reversal bar.
 SpreadMIN
The indicator is a histogram of the lowest/minimum spread only, given in a candle whilst the indicator has been running. Example scripts for placing buy or sell at the lowest spread are included.