Join our fan page
- Views:
- 7219
- Rating:
- Published:
- 2012.12.20 07:25
- Updated:
- 2016.11.22 07:32
-
Need a robot or indicator based on this code? Order it on Freelance Go to Freelance
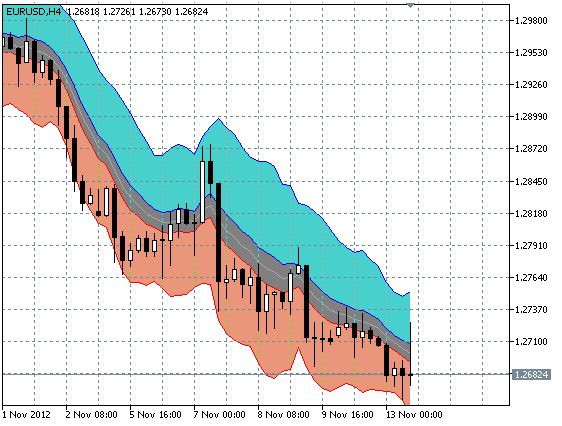
The main idea is to consider that the change of a trend is not MA crossing, but the output prices of a flat zone. In other words, in flat (perhaps more appropriately be called "dead") zone, deals are not concluded, which can serve as a kind of filter to filter out false crossings of the Moving Average.

Recommendations:
- Make sure that in the chart properties (F8) on "General" tab the check mark stands opposite to properties "Chart on top".
Translated from Russian by MetaQuotes Ltd.
Original code: https://www.mql5.com/ru/code/1270
 PriceChanel_HTF
The Price Channel indicator. It draws the line of high and low price values for the last N bars from high timeframe
 OsHMA
OsHMA
The OsHMA oscillator is the indicator of the difference between two HMA (between two Hull Moving Averages).
 Exp_XMA_Ishimoku_Channel
The breakthrough system using the XMA_Ishimoku_Channel indicator.
 Gaus_MA
The indicator calculates the Moving Average using a modified algorithm of the linearly weighed Moving Average.