Join our fan page
- Views:
- 5168
- Rating:
- Published:
- 2015.04.08 15:44
- Updated:
- 2016.11.22 07:32
-
Need a robot or indicator based on this code? Order it on Freelance Go to Freelance
Original author:
Geokom FX Lab
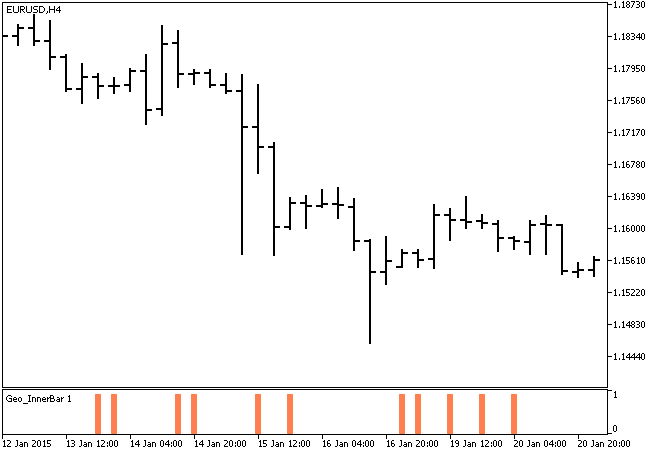
The internal bar indicator shows locations of temporary price consolidation.
Internal bar is a bar whose High is below the maximum of the previous bar and Low is above the minimum of the previous bar.
When the next candle doesn't break through previous turning points it is logical to predict the price consolidation period.
It is possible to make a strategy based on the exit from this range.
Originally this indicator has been written in MQL4 and was first published in the Code Base on 2.03.2012.

Fig. 1. The Geo_InnerBar indicator
Translated from Russian by MetaQuotes Ltd.
Original code: https://www.mql5.com/ru/code/12524
 ind_aMU
The indicator shows trend and side (flat) price movements.
 ExtremLine
A simple trend indicator.
 Rj_SlidingRange
One more analog of Bollinger Bands and envelopes with a similar working procedure.
 Negative_Volume_Index_HTF
Negative Volume Index (NVI) with the timeframe selection option available in the input parameters.