Join our fan page
- Views:
- 91039
- Rating:
- Published:
- 2013.12.20 08:57
- Updated:
- 2016.11.22 07:32
-
Need a robot or indicator based on this code? Order it on Freelance Go to Freelance
Author: *** UPDATE *** see below
Programming by William Kreider (madhatt30) but the original Value Chart was developed by David Stendhal.
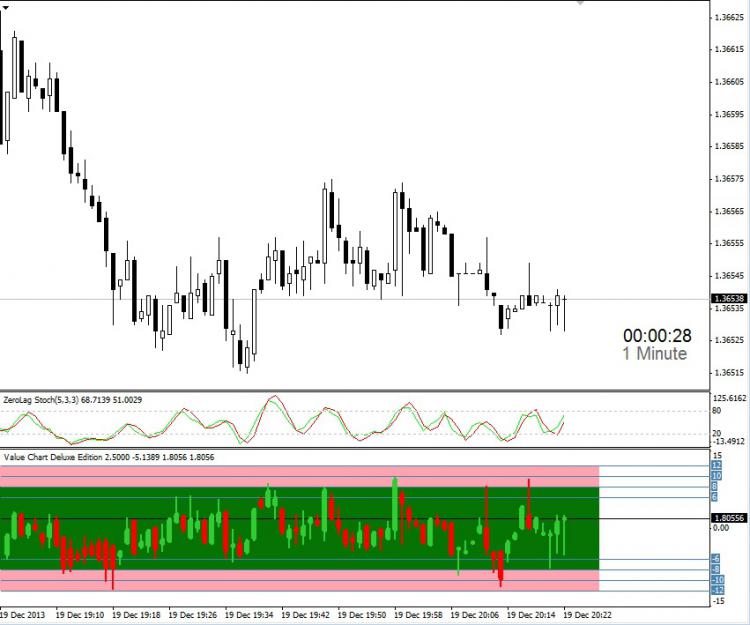
The Value Chart was developed to show the valuation of the market.
The Value Chart could be described as a DeTrended Oscillator in which the higher or lower the value on the Value Chart the more likely it is to reverse direction.
Unlike other Value Chart Indicators you may be able to find there has always been one huge problem with it and that was that it really taxed the terminal by deleting and creating ALL Value Chart Bars on Every Tick. This Indicator does not have that issue so it will not tax your Terminal.This indicator updates only the Value Chart Bars that have changed. So you are free to put it on multiple charts.
Additional features:
- Adjustable Value Chart Bar and Wick Color, Bar and Wick Width, Adjustable overbought and oversold area and color, Built in Alert and alert levels.
- You WONT find anything else like this and best of all I'm giving it away.
- This indicator works on any standard timeframe.
- This indicator is not designed to be traded alone in fact it works great as an addition to an existing strategy. For example using the Value chart with the Zero Lag Stochastic set to 5,3,3. If you don't have Zero Lag Stochastic you can use a standard stochastic set to 3,3,5. when the Stochastic crosses above the 80 level and the Value chart is between 8 and 10 consider a sell or if the stochastic is crossing below 20 and headed up and the Value Chart is between -8 and -10 then consider a buy. I trade 60s Binary options with this strategy and it works great.
Input parameters:
- extern int NumBars=5;
- extern color Bullish_Color=LimeGreen;
- extern color Bearish_Color=Red;
- extern color Actual_Color=Yellow;
- extern string Note0="**** VC Bar Width ****";
- extern int Wick=2; * The width of the VC Candle Wick
- extern int Body=6; * The width of the VC Candle Body
- extern string Note1="**** OB/OS Levels ****";
- extern int OBHigh_Upper=12; * Top of the OverBought Area
- extern int OBHigh_Lower=8; * Bottom of the OverBought Area
- extern int OSLow_Upper=-8; * Top of the OverSold Area
- extern int OSLow_Lower=-12; * Bottom of the OverSold Area
- extern string Note2="**** OB/OS Level Colors ****";
- extern color OBHigh_Color=C'255,164,177'; * OverBought Area Color
- extern color Normal_Color=C'5,116,5'; * Normal Area Color
- extern color OSLow_Color=C'255,164,177'; * OverSold Area Color
- extern string Note3="**** Alert Settings ****";
- extern bool useAlerts=false;
- extern int NumLevels=4;
- extern int level1=10;
- extern int level2=-10;
- extern int level3=11;
- extern int level4=-11;
- extern int level5=10;
- extern int level6=-10;
Recommendations:
Quick Strategy:
Use a Keltner Channel with default setting
Stochastic 5,3,3 (Preferably Zero Lagg)
Value Chart Deluxe Edition (Default Settings)
Good luck and by all means drop me a message if you like this indicator or if you have an indicator for another platform that is not available for MetaTrader 4.
** UPDATE ***
Additional options for levels and code fix
**** UPDATE ****
New version Value Chart Deluxe Edition v1.0.2
Whats New in this version
1. The annoying bug of candles being drawn past the current bar has NOW been fixed. (I back tested and forward tested this for a week and the forward test works great but backtest does not)
2. The normal area (green color) can now be customized (Set all Color fields to NONE if you don't want colors)
3. Added new parameter; BarsBack=1000 to specify how many bars back to draw colored areas. set to 0 for all bars
4. Added new parameter; useExtern=false; Set to true to use this indicator externally by way of iCustom. That's right you can have access to the Value Chart from another indicator by using iCustom
for example
iCustom(NULL,0,"Value Chart Deluxe Edition v1.0.2", 5,"",true,0,0); *VC Bar High
iCustom(NULL,0,"Value Chart Deluxe Edition v1.0.2", 5,"",true,1,0); *VC Bar Low
iCustom(NULL,0,"Value Chart Deluxe Edition v1.0.2", 5,"",true,2,0); *VC Bar Open
iCustom(NULL,0,"Value Chart Deluxe Edition v1.0.2", 5,"",true,3,0); *VC Bar Close
5. Additional Code Cleanup
I've attached the new version of this indicator be sure to download v1.0.2 as it is the latest release
 ALGLIB - Numerical Analysis Library
ALGLIB math function library (v. 3.5.0) ported to MQL4.
 Time indicator
Time indicator displays broker time and local computer time on the chart.
 Renko Range Detector
Detects and displays the fixed size of Renko Bars/Candles on offline chart.
 Constant Range Detector
Detects and displays the fixed value of Constant Range Bars/Candles.
