Join our fan page
- Views:
- 14399
- Rating:
- Published:
- 2013.05.28 05:57
- Updated:
- 2014.04.21 14:55
-
Need a robot or indicator based on this code? Order it on Freelance Go to Freelance
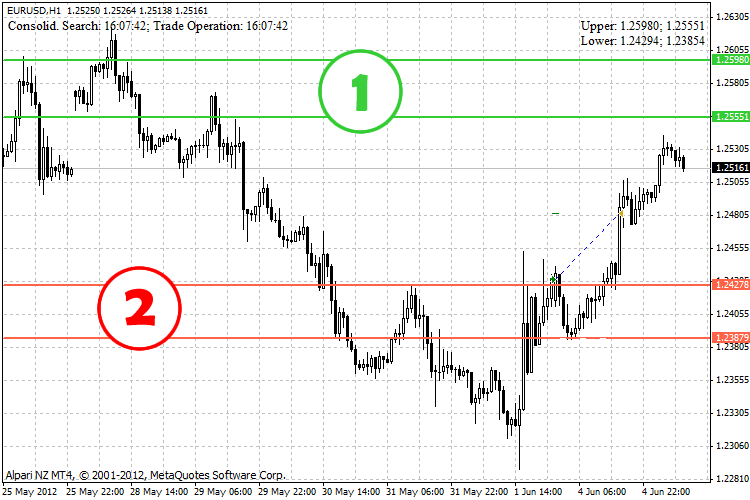
I have decided to post the basics of maximus expert advisor for public consideration. This includes identification of consolidations in the chart and trading based on consolidations. Price consolidation is a spot in the chart where market gets stuck and cannot make a definite move for a while. Maximus tracks such consolidations in the past, draws them in the chart and then opens deals if consolidations' boundaries get hit. Two green lines on top define a buy consolidation (which can also lead to a sell deal in the opposite direction), two red lines at bottom define a sell consolidation (which can also lead to a buy deal). White lines are the start and end of where a consolidation was identified. If you don't see white lines, this means a consolidation was identified based on pivot points (these can be 1.2500, 1.2600, 1.2700 etc for EURUSD). So simple.
Parameters. Parameters which set up the EA resemble those used in previous versions of maximus (check out info in my profile):
- delay_open – once this expires a new deal may be opened (1 - 15 mins, 2 - 30 mins etc); timer restarts after each trade operation;
- distance – points from consolidation after which a deal opens;
- period - once this expires, a new consolidation search is performed (hours);
- range - minimal range between lower and upper consolidations;
- risk - this defines lot; the higher the value, the lower is lot;
- stop_loss - should not be changed;
- trail - usually should accept same values as range does.
Limitations. The above code:
- works only on a demo account and only with EURUSD
- relies on global variables which should be removed before each new session
- does not include a whole range of functions which should be optimal for finalizing the logic of the advisor (automatic calculation and compensation of potential losses, tracking piques based on standard deviation, automatic optimization of new trading parameters, "add-on" deal, "against the grain" deal, sounds and error printing)
- includes a number of intentional errors, so it MUST NOT be used on live accounts, even if modified
- may only be used with 5-digit depo
Proceeding method. Forex newbies, your straightforward "I-shall-kill-you-in-a-minute-by-testing-on-a-period-of-3-years" tactics will fail you just like that. No advisor can stand a 3-year test with the same parameters. Even if it can, you will most certainly get a close to zero profit. So the basic proceeding method is the same as the one described for other versions of maximus (check out more info in my profile). To summarize. Optimizing 1-1.5 k variations for a period of 1-2 weeks, matching most profitable parameters and trading for the next week based on these new parameters. H1 chart EURUSD, all calculation is performed based on 15 min timeframe.
Brainstorm. My purpose is to discuss this consolidation based trading. Looking forward to hearing any suggestions regarding consolidation improvements. For example, the picture shows: 1) a consolidation somewhere in the lower part of a long-term trend up and 2) a consolidation of a trend down which ran out. These are different types of consolidations. It probably stands to reason to integrate a kind of type assignment and, say, open different lots matching different consolidations. Please tell me what you think!
Misc. I am not going to read internal messages, any discussion should be open and develop on this page. If you ask me to implement 4-digit deposit methods, other instruments, modify it to work without global variables, explain once over what consolidation is etc etc, I am going to yawn at you.

Translated from Russian by MetaQuotes Ltd.
Original code: https://www.mql5.com/ru/code/10785
 RSI Breakout
The Expert Advisor places buy trades when RSI crosses above 73 and sells when it drops below 27. A trailing stop based on ATR protects profits.
 Zigzag with line at lows and line at highs
See http://forum.mql4.com/54660 for getting a connection between highs and a connection between lows. I made a zigzag this way.
 Non Repainting Supertrend Indicator
This is a new implementation of the SuperTrend indicator for MetaTrader 4. The SuperTrend indicator is an application of the concept of MAE (maximum adverse excursion), which was introduced by John Sweeney in the mid-nineties.
 VR---ORDERS
Indicator displays information about the current positions