

This post is to explain this product in detail:
https://www.mql5.com/en/market/product/124355
About:
Looks for price making a trend flip pattern.
Importance of this pattern is that after it happens, price tends to range a bit and then breakout right after.
Features:
- Looks for trend flip pattern
- Num of bars creating pattern
- Extend lines to right to wait for breakout
- Bull/Bear Strength for candles making the pattern
- Filter using Halftrend/NRTR
How it Works:
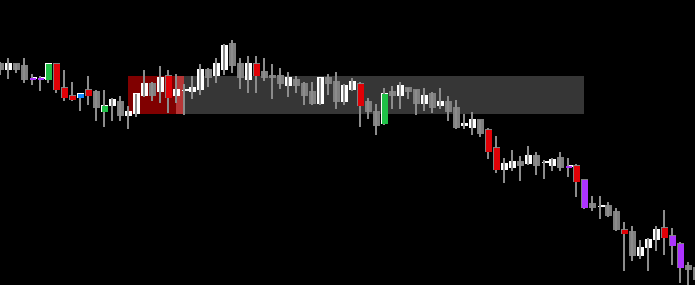
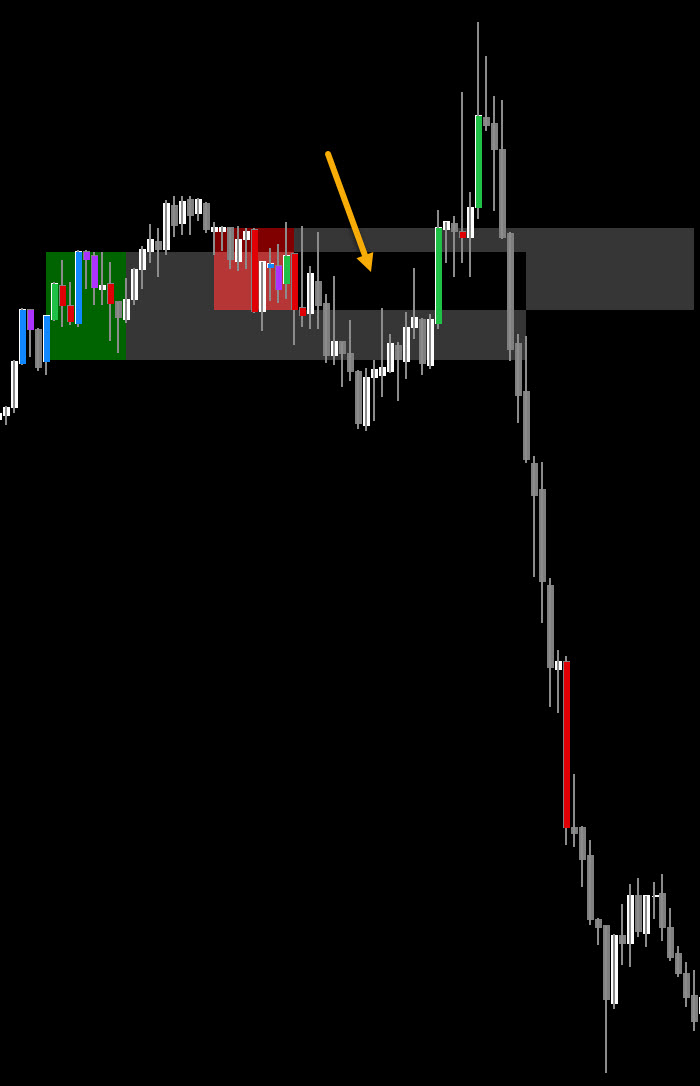
Use this technique for scalping. After a pattern happens, you will see a red/green rectangle.
Red means a Bearish pattern and green means a bullish pattern. Then wait for a strong high volume bar to break out of the grey lines.
You can extend the lines however much you like, because after breakout, these important levels can also act as strong support/resistance lines.
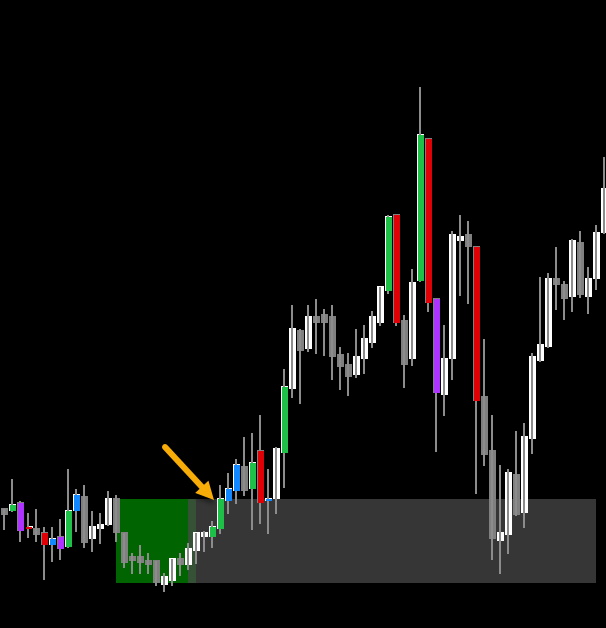
In above example, the pattern happened and breakout happened 4 bars after it.
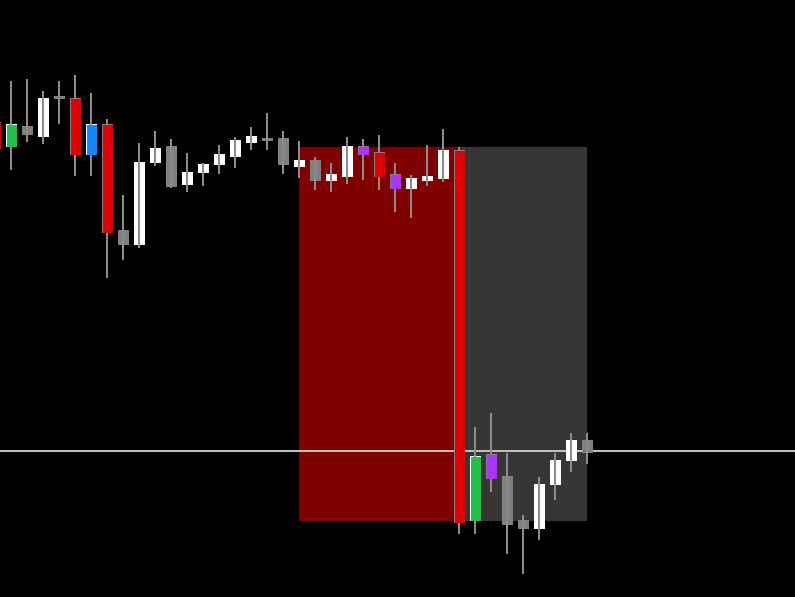
Especially good is if multiple high volume bars happen before bar breaks out of grey area. This indicates a strong pattern:
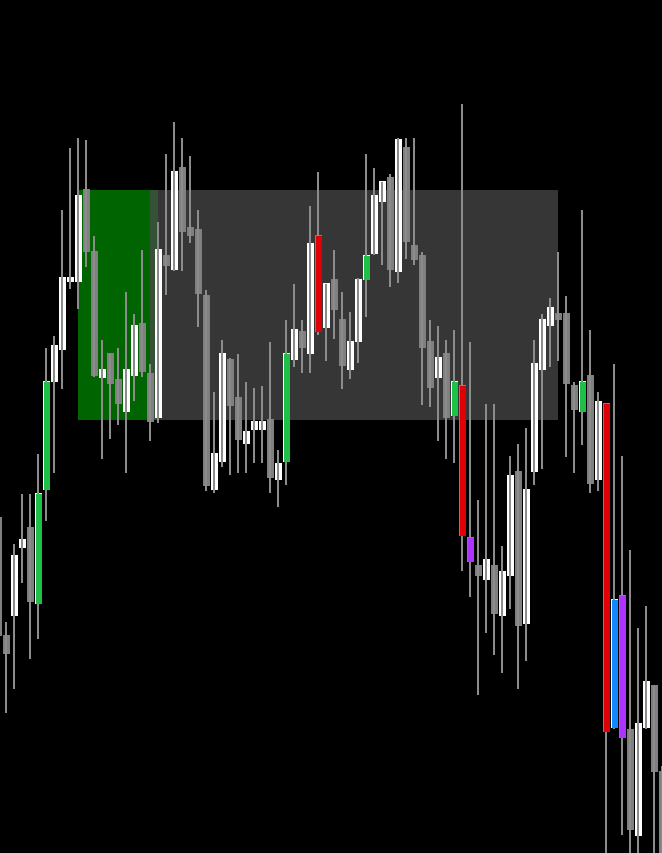
Sometimes, if breakout doesn't happen and price keeps ranging sideways, then avoid the trade:
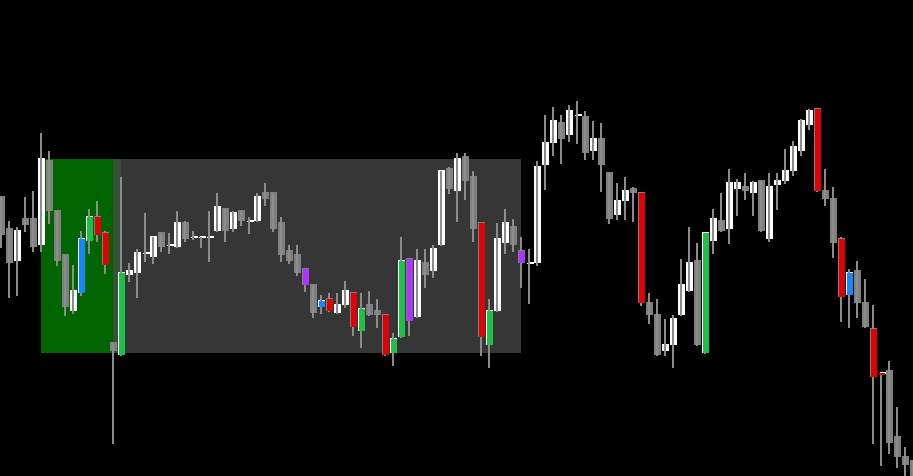
This indicates that price is ranging and so wait for it to pick a direction.
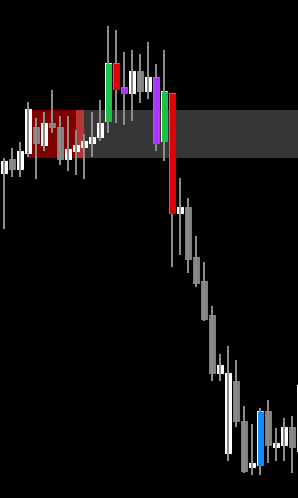
Importance of using high volume breakout bars is that if price isn't strongly bullish like in example below, then it might reverse.
You might get some green bars inside the grey box, but look for strong green volume bars breaking out of the box upwards.
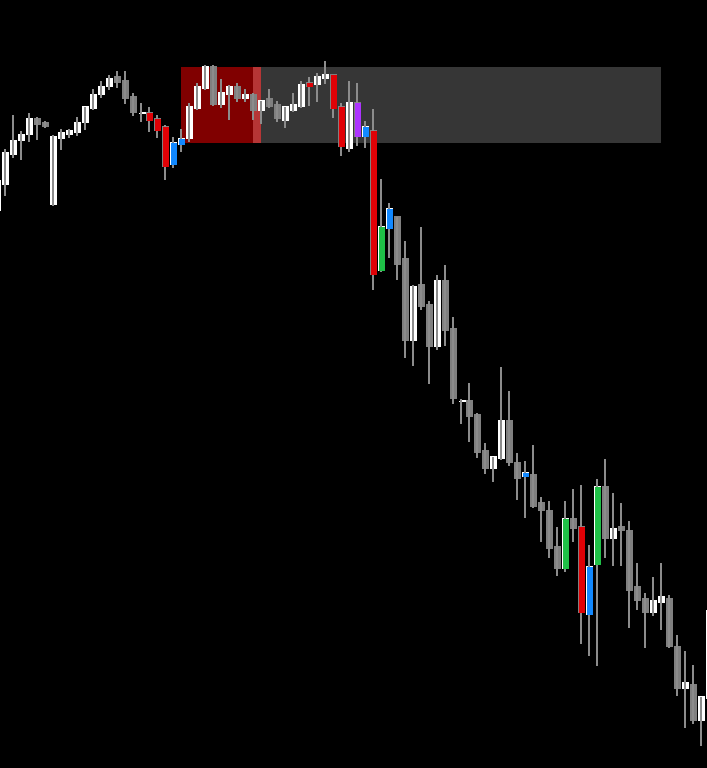
Same way for Bearish patterns, look for a strong red volume bar breaking out downwards.
In a very low volatility market, price won't go too far, so avoid that time when pair is not active:
But same way, if breakout bar is too strong, then be careful as price will re-adjust and retrace back, so wait:
If pattern is bearish but breakout bar is strong green bullish breaking upwards, ignore those. Be careful about the pattern color. And wait for a correct bearish breakout bar.
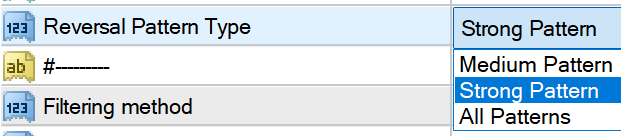
Pattern Strength:
Strong vs Medium. All patterns will give more signals. But Strong strength is recommended.
Max Pattern Height:
Set the max height in points. When pattern breakout bar is too long, there is almost always a retracement back to the grey box. So, better to trade only medium height patterns.

Also, not too small patterns as that would indicate low volatility.
Note that these are just sample values by default. Please use cross hair tool on your pair to determine the best point values:
https://www.mql5.com/en/blogs/post/763086
Trend Filter:
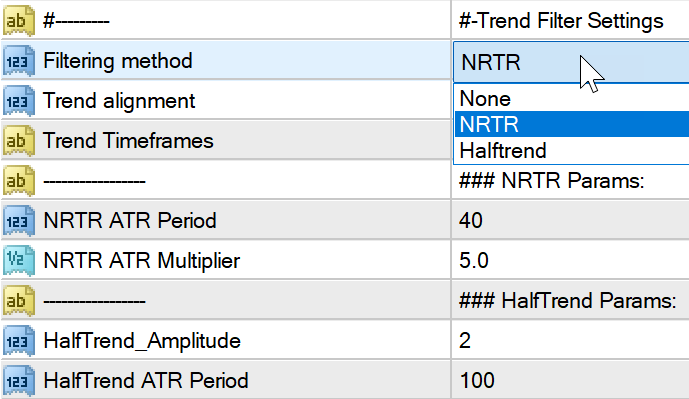
Price mostly ranges sideways... and then breaks out and follows an overall trend. So, it is better to trade in direction of overall higher timeframe trend.
That's where Trend filters are useful. There are 2 choices: Halftrend or NRTR. It will depend on your style of trading. NRTR is mostly SR based. And halftrend is trend based.
If you are only quick scalping, then you can keep Trend Align to None. And trade with very close stops.
For a better trend, Select Higher timeframes for each current timeframe using Trend Timeframes:
e.g "M5=M30,M15=H1,H1=H4,H4=D1"
will mean that for current timeframe say M5, use halftrend/NRTR from higher timeframe M30 and so on...
All Parameters:

Alerts:
Alerts are only for when a pattern happens. Suppose you have shiftbars set to 0, then it will start looking from current bar and will give an alert if pattern has ended on current bar.
There are no alerts for a breakout bar. Since some people will use high volume breakout bars, while others might not, there will be too many breakouts. And thus multiple alerts every time a bar exits the grey area.
So no alerts for breakout bars.
Note: Sorry, but there is no scanner in the works for this one :)
I want to keep this as a simple manual trading system for a single chart.
Because actual trade should not happen as soon as pattern occurs. It should only happen after a breakout. And scanner alerts for a pattern might confuse users to trade immediately.
But if I ever build a scanner, I'll update it here.
Not A Bug:
If you see grey lines overlapping, because 2 patterns are too close together, then MT4 will just change the overlapped portion's color based on what you selected.
This is not a bug in the indicator. It's how MT4 handles overlapping objects.
Debug:
Use the Debug Text true if you want to know why a signal was skipped.
e.g:
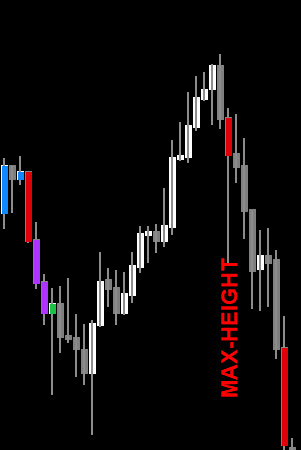
MAX-HEIGHT:
Signal skipped because breakout bar height was more than max height set in settings.
Different pairs/commodities/crypto/stocks etc will have different point systems.
So always check using cross-hair tool and set the correct Max Heights for all timeframes you are using.
Or else it will block too many signals.
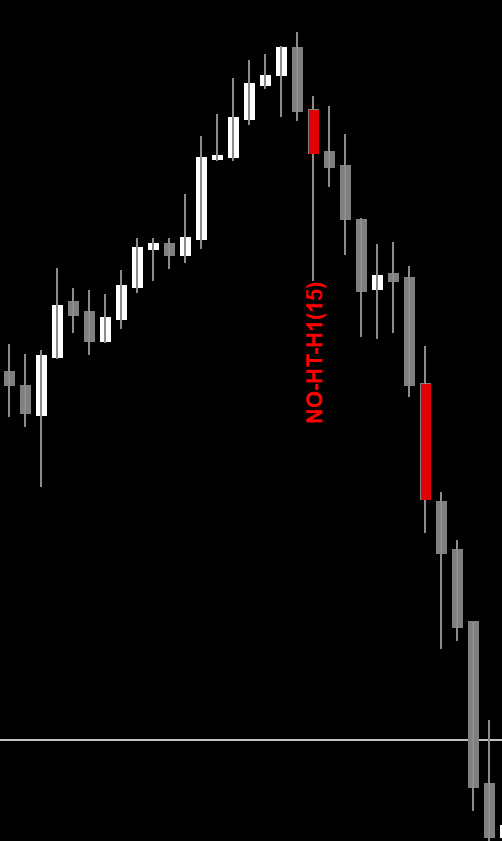
NO-HT-TF (bar_number):
e.g.:
NO-HT-H1 (15) means Halftrend was not aligned on higher timeframe H1 on bar15(currentTF).
NO-NRTR-TF (bar_num):
Will indicate no NRTR trend align for higher timeframe (TF) for bar number (bar_num) on currentTF.
Thanks for reading!


![[Two Different Approaches to Market Timing]: The Spiral Calendar and the VISTmany Research Project](https://c.mql5.com/6/1012/splash-preview-771691.png "[Two Different Approaches to Market Timing]: The Spiral Calendar and the VISTmany Research Project")

