Session Expected Risk Date Range Analyzer: Analyzes price data across specified date ranges to provide detailed insights into financial risk and volatility, using each bar's price metrics for accurate risk assessment.
The Session Expected Risk Date Range Analyzer is a sophisticated tool designed to offer traders and analysts detailed insights into the expected financial risk across specific date ranges. Unlike traditional session-based analysis, this indicator focuses on calculating risk metrics based on each bar's price data, utilizing various price types such as high, low, close, open, weighted median, and typical prices. This approach provides a nuanced understanding of price volatility and risk over the selected periods.
**Note:** When the trading platform is closed, the indicator may not load correctly. To ensure it works, you may need to load the indicator, unload it, and then load it again.
**Note:** This indicator is intended for use with historical data and does not support real-time data analysis.
**Note:** When switching to a different timeframe, it's recommended to switch back and forth between timeframes to ensure that all data loads properly. This process helps to fetch the necessary historical data, ensuring that calculations based on this data are accurate.
Link to MT5 product: https://www.mql5.com/en/market/product/122240
Link to MT4 product: https://www.mql5.com/en/market/product/122259
Key Features:
1. Customizable Date Range Analysis:
- Start Date and End Date: Users can define precise start and end dates for the analysis, allowing for a thorough examination of price risk over specific periods. This feature is useful for studying historical risk patterns and market behavior during critical events.
2. Bar-Based Risk Calculation:
- Unlike session-based tools, this indicator calculates risk metrics based on each bar’s price data, including high, low, close, open, weighted median, and typical prices. This method provides a more granular view of risk and volatility across the chosen date range.
3. Financial Expected Risk Formula:
- The indicator uses the financial expected risk formula to assess potential risk levels, offering a quantitative measure of volatility and price behavior. This approach helps in understanding how different price metrics contribute to overall risk.
4. Enhanced Risk Insights:
- By focusing on bar-based price data, traders and analysts can gain a deeper understanding of risk dynamics within specified periods. This detailed analysis is valuable for refining trading strategies and assessing historical risk trends.
5. Application for Historical Data Analysis:
- The tool is ideal for analyzing historical data, making it suitable for users interested in long-term risk studies and the impact of historical events on price volatility.
Practical Use Case:
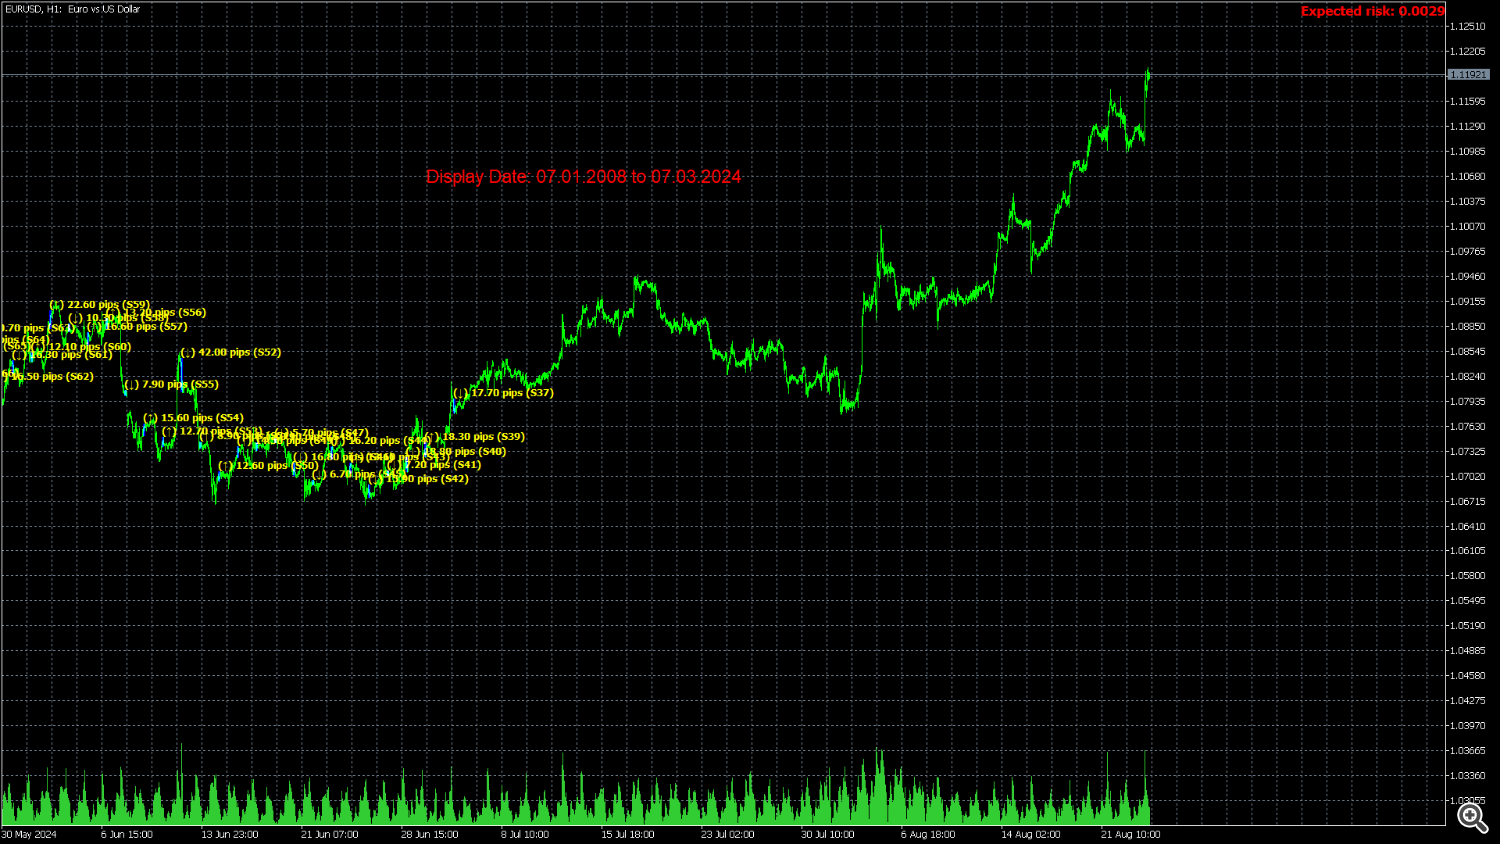
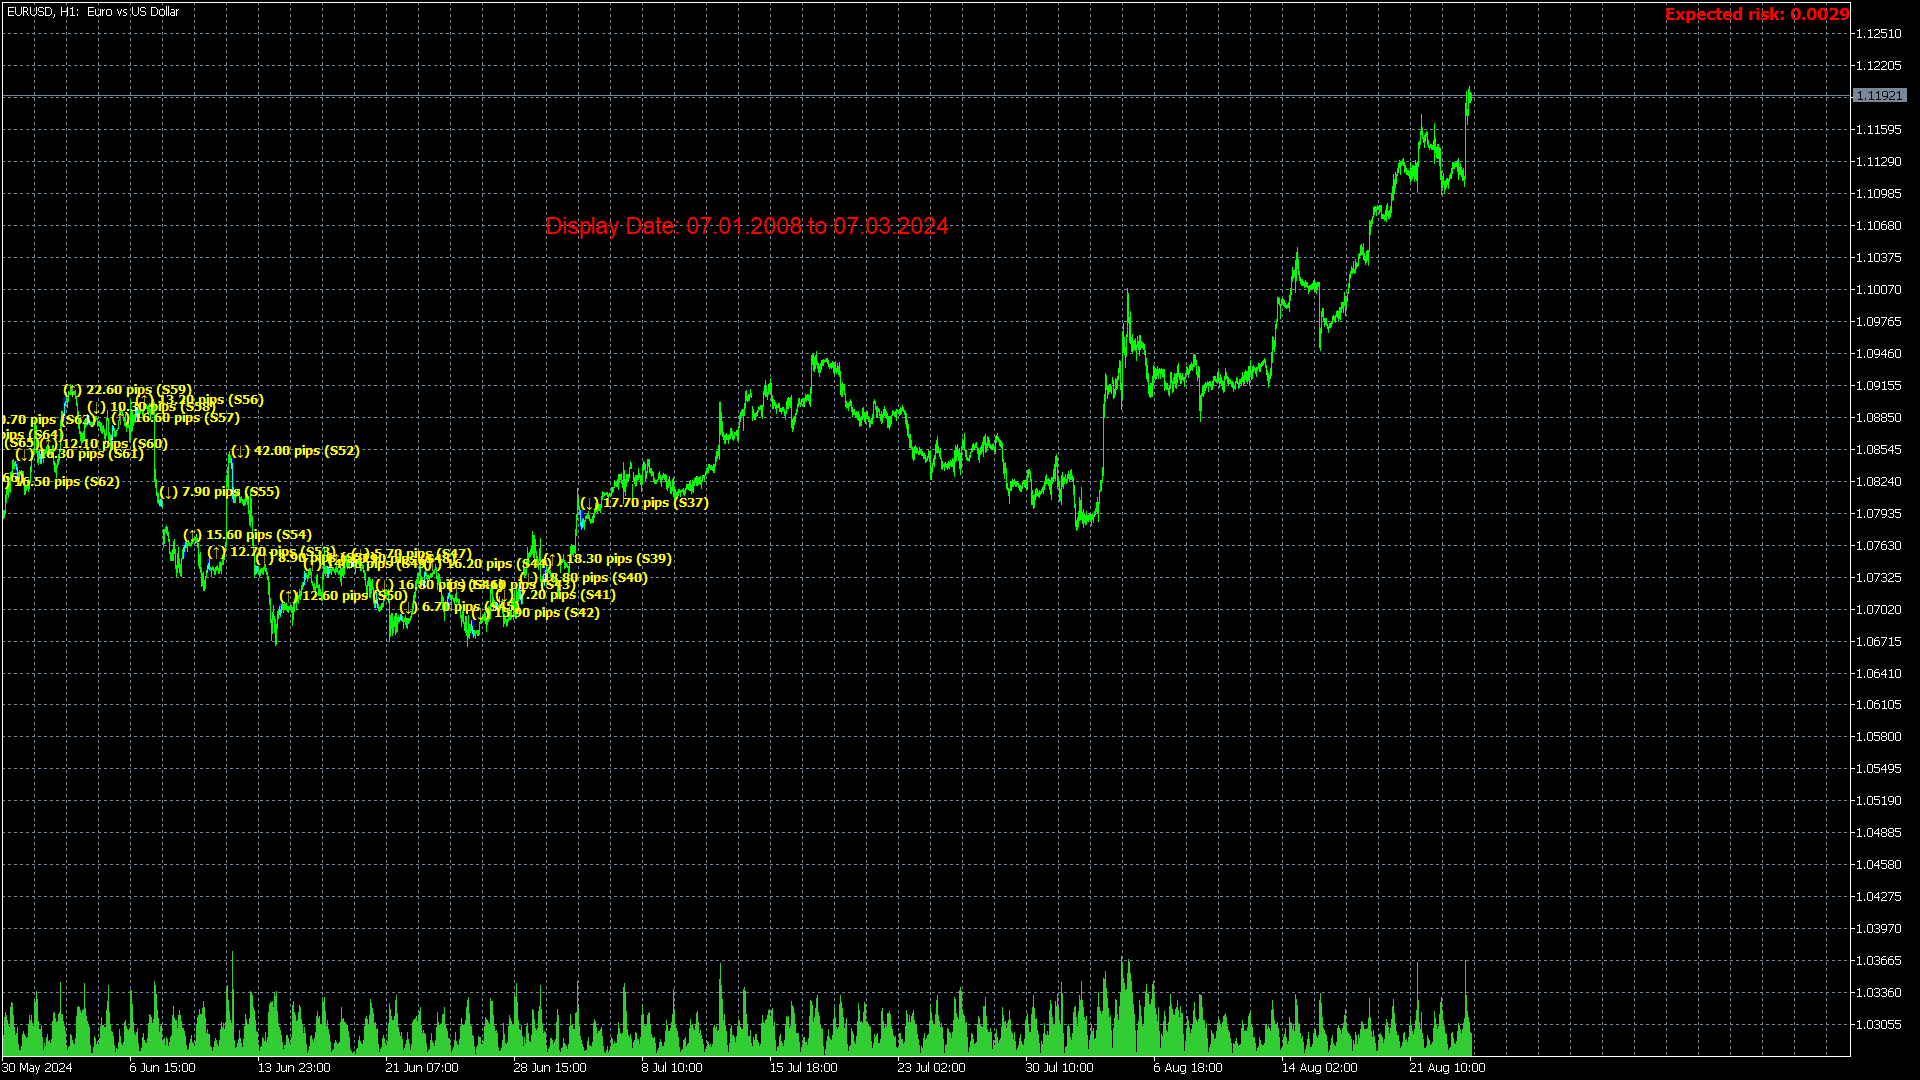
Consider a trader analyzing the risk associated with EURUSD during a volatile market period. By using the **Session Expected Risk Date Range Analyzer**, the trader can specify the start and end dates for the analysis, and the indicator will calculate risk metrics based on each bar’s price data. This detailed analysis helps the trader understand the risk profile and adjust trading strategies accordingly.
**Note:** This indicator is designed to work with timeframes of H4 and below.
Main Inputs:
- InpPrice: Specifies the type of price used for standard deviation calculation within the selected session and date range. Options include:
- High: Use the highest price of each bar.
- Low: Use the lowest price of each bar.
- Close: Use the closing price of each bar.
- Open: Use the opening price of each bar.
- Weighted: Use the weighted price of each bar.
- Median: Use the median price of each bar.
- Typical: Use the typical price of each bar.
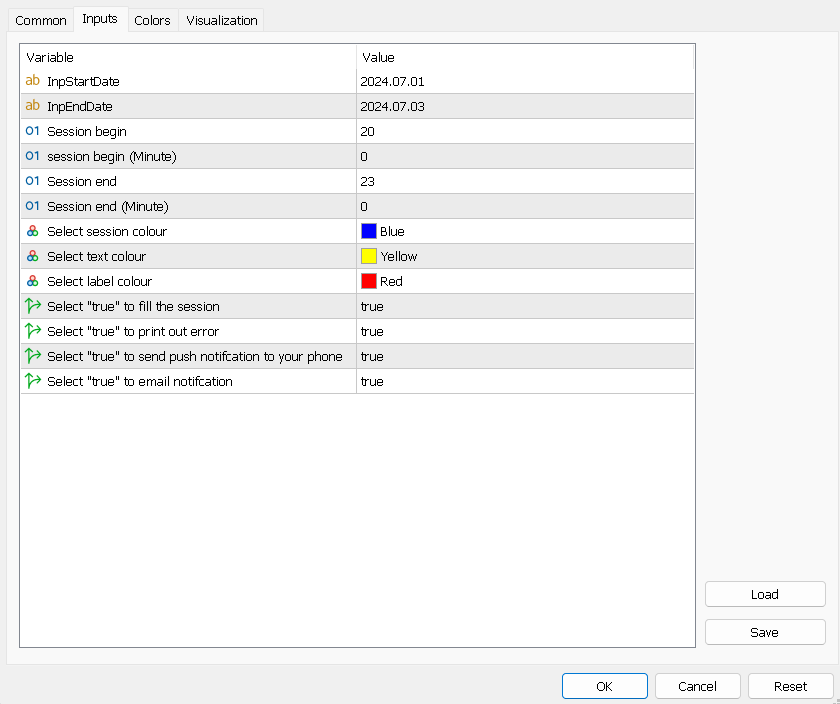
- InpStartDate: Specify the beginning date for the analysis period. This defines the start of the range for risk evaluation.
- InpEndDate: Define the ending date for the analysis period. This marks the end of the range and limits the risk evaluation to this date.
- SColor: Choose the color for displaying the risk metrics on the chart. `clrBlue` will show the risk in blue.
- InpTextColor: Set the color for the text displayed by the indicator. `clrYellow` will render the text in yellow.
- InpLabelColor: Define the color for labels within the indicator. `clrRed` will color the labels red.
- InpFill: Select whether to fill the risk area with color. `true` fills the risk area with the color specified by `SColor`.
- InpPrint: Determine whether to print error messages to the log. `true` enables error logging.