
Hello everyone,
In today's blog I will discuss an important topic with you.
Its about Charting, Most of people watch wrong chart and that may result in their EA to fail or not perform with great accuracy. Their logic may have high win rate but they fail for unknown reasons and their Stop loss hits which makes trader confuse about what is wrong. In an attempt to find solution, its impossible to find it why it fails. I am saying impossible because you are viewing wrong DATA. If you do not have right data how come you will get high accuracy?
So lets discuss about this.
In Crypto, brokers offers many types of products to trade. The popular one are perpetual futures, these are the futures where there in no expiry. Some exchange also offers European Options to trade. As you all know Futures and options are products where you get obligation to buy or sell but in actual you do not own the product. For example if you buy futures in $SOL it means you think that price may go up before a particular time (expiry) if that is a non-perpetual futures. If its perpetual futures you can hold your position for unlimited time until the symbol gets delisted from exchange but you have to pay a funding fee every few hours which may be different based on the exchange terms, This funding fee is in percentage which makes holding costly and that is why perp futures becomes one of the hottest product for scalping and trading where a trader holds a position for short term.
In Crypto, The biggest exchange in the world is Binance. In crypto there are dozens of exchanges which has their own formula to show price.
You may see normally three types of prices in Crypto exchanges.
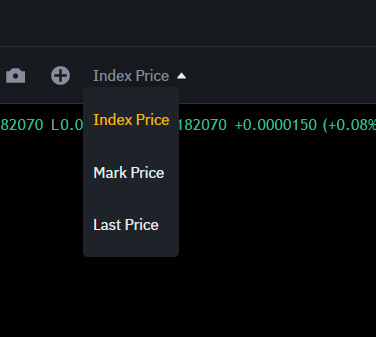
When you trade any product you should always watch Index price. If you trade in Binance, always watch Index price only. but your orders may be executed slightly different than what chart you watch because Futures - last or mark and Index charts may have different prices. The reason behind this is Index chart are operational on a formula which is watched and tracked by Institutional traders but Retail trader do not know such things so they watch Last Price chart and may keep failing due to wrong data.
Since Binance is world' s biggest exchange I recommend to watch Binance Index chart only. But there are different exchanges who may offer their own index price.
If you watch any other chart than Index chart, its highly likely your research and strategy may fail for unknown reasons.
In Crypto there are different exchanges who rely on some data of Index, for Example India and China is most populated country in the world but you want to open an exchange in "Holy See" which is least populated county in the world. If your customers are very less, your charts will look like this
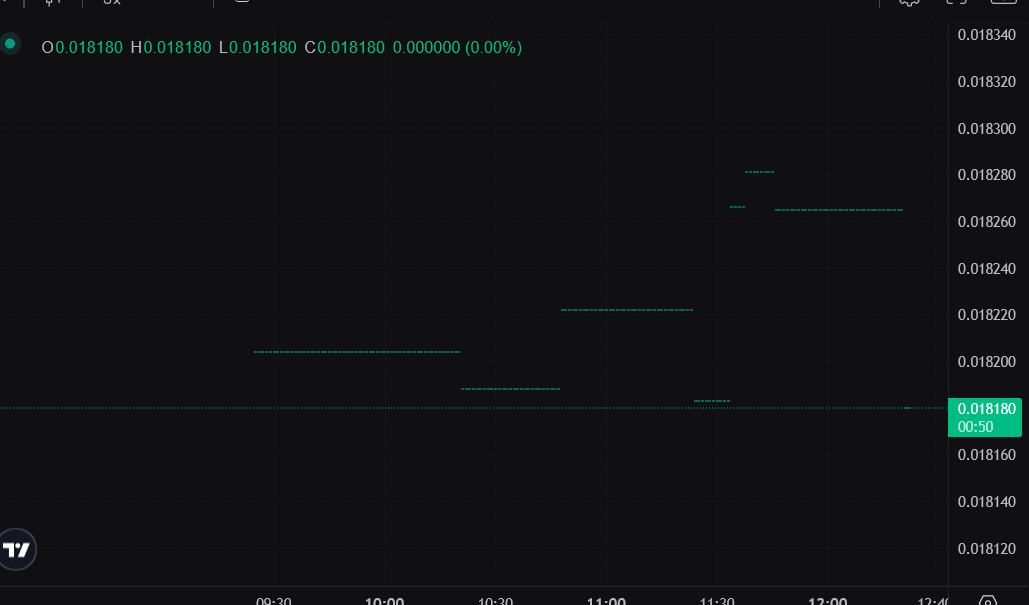
This makes no sense but its still moving, on what basis it will move? The Global Index. Your price needs moving based on the calculation of Index offered by exchanges in India and China. Lets suppose Binance is ruling those countries with largest customer base.
You create the API and fetch prices of Indices of every symbol of crypto from there and moving your symbols based on the formula of global indices.
Lets take an example of Delta Exchange for Crypto where they have made their own index called .DEXBTCUSD and its forumla you can see in screenshot below
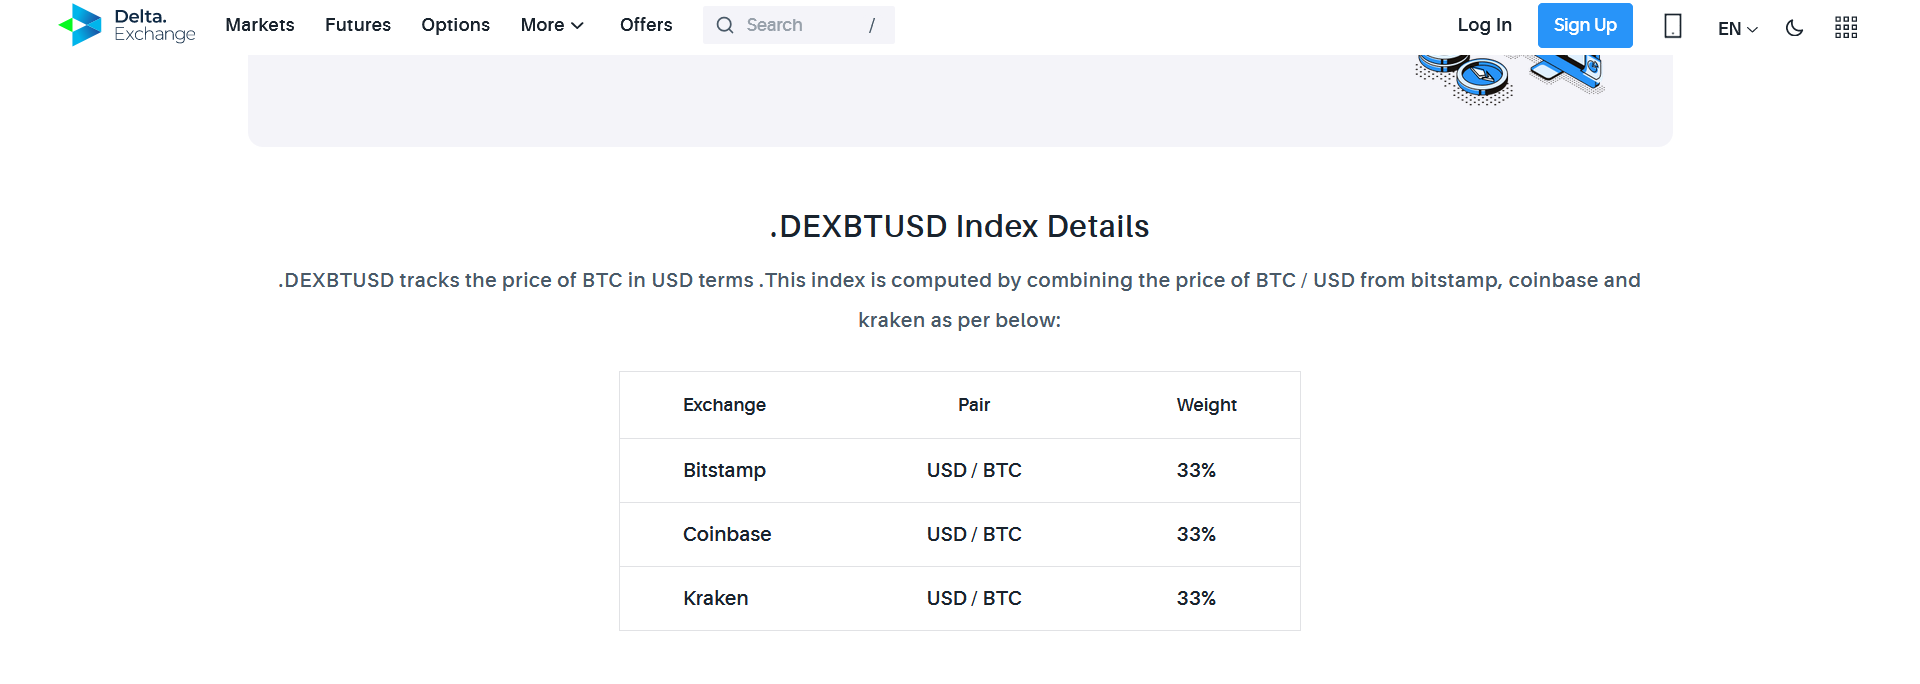
As you can see this exchange follows up Bistamp Coinbase and Kraken by 33% weight of each and produce you a chart which you trade. Do you think you may have good win rate if you do analysis on this chart? My answer is never. You must only watch chart of Binance Index and you are allowed to place your bets on Futures or options on any exchange. We make money if we get Raw data and not cooked / modified data. Its all malicious for a trader especially day traders.
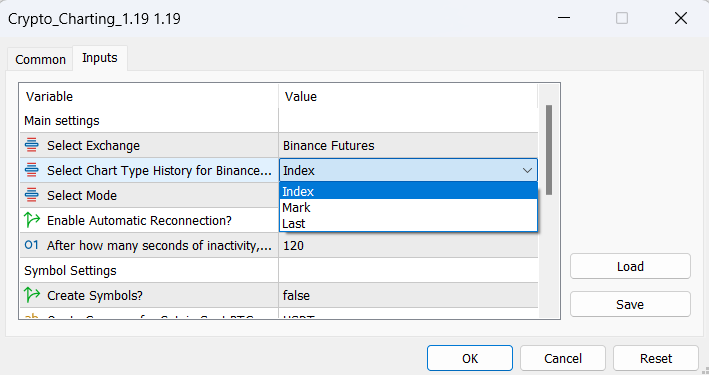
I have created a best product for Crypto charting where Index prices of Binance will be updated to history using this utility in Binance so thats make sure whatever research you do or test your Expert advisor, you become protected from false data.
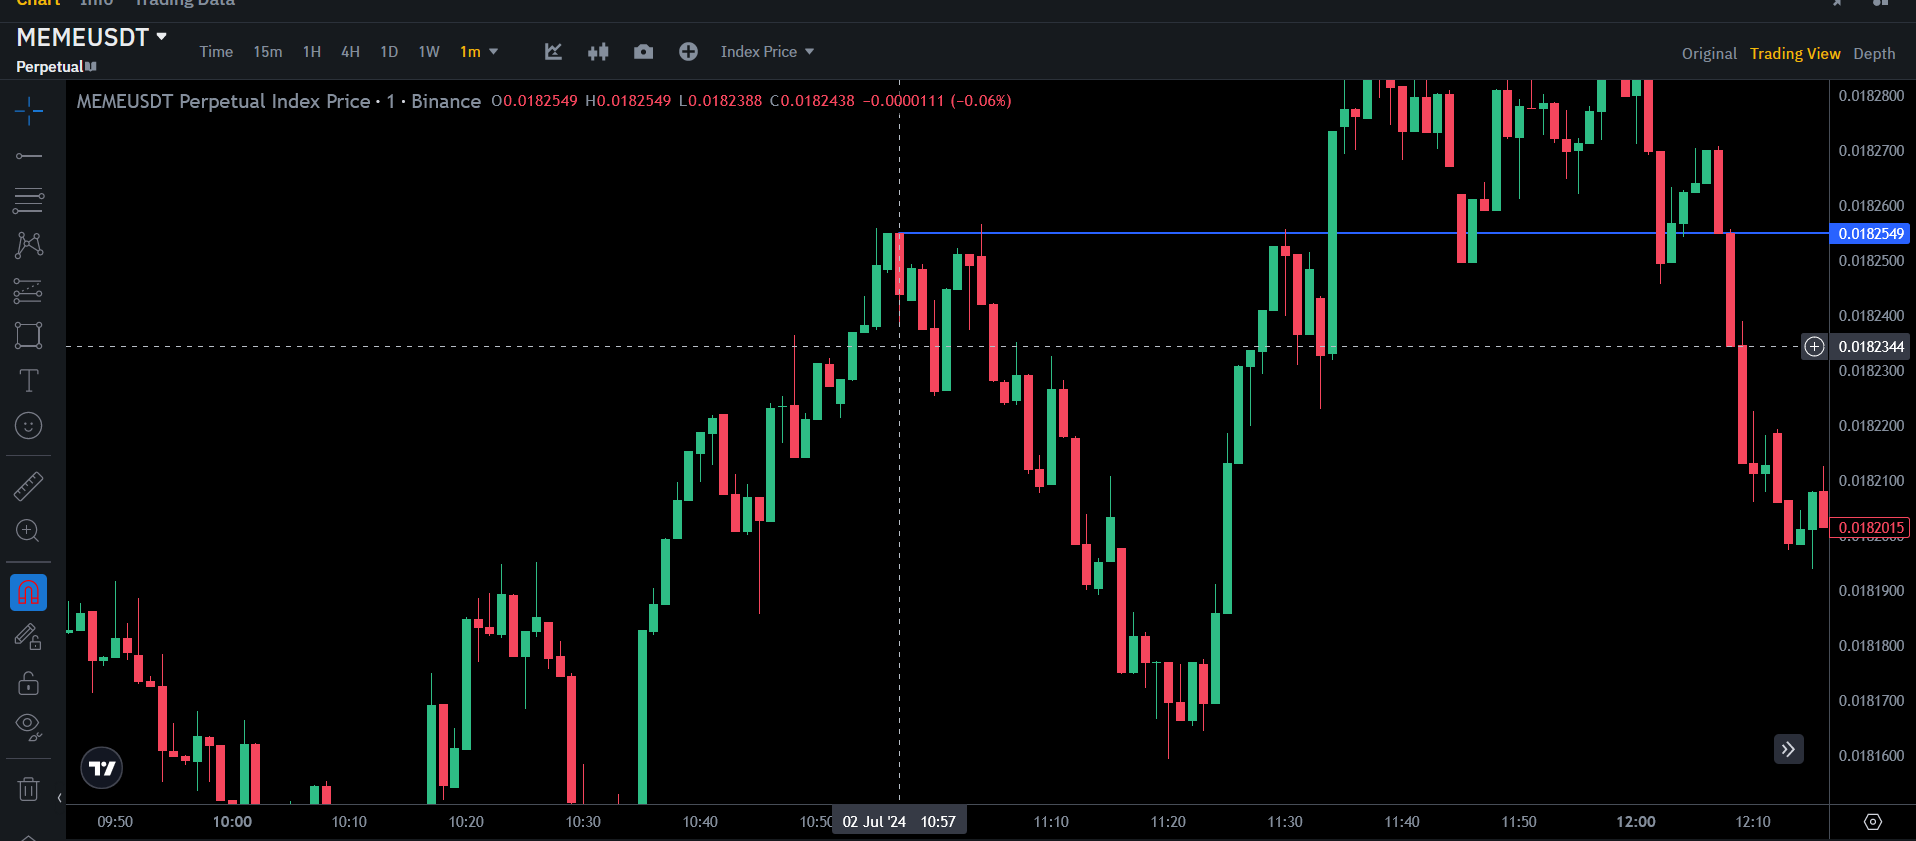
Now i show you a proof by comparison of Index chart and Last Price chart where a strategy failed but worked in Index price. $MEMEUSDT is symbol
Let me post chart of Index. See time : 10:57 UTC High which is marked
Now lets see Last price chart See time : 10:57 UTC High which is marked
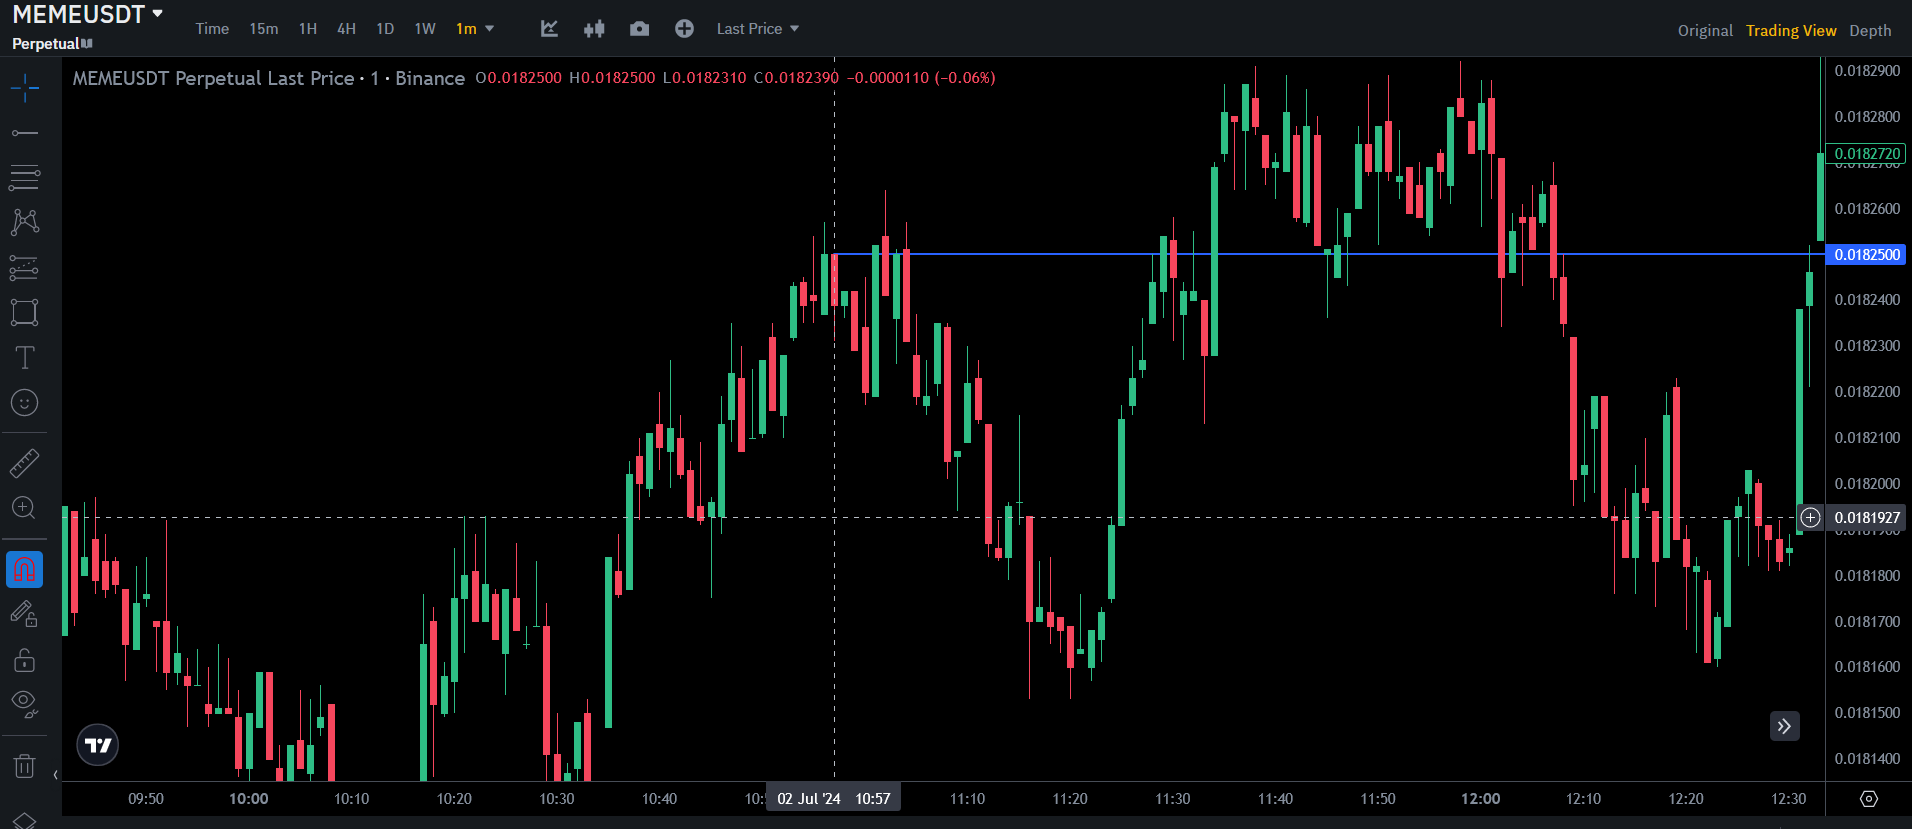
Now take a close look on Upper bodies of these candles, you will notice that they are different, Last price chart makes no sense to me because they have been based on the bets places by traders who watch Index chart. If you apply Line chart you get complete different highs and since you know most strategies are based on high low on line chart, You may be clueless why they are failing if you watch Last or Mark price chart.
Disclaimer : Advice on watching Index chart is based on facts I shared and my own research. It affects usually day traders who watch low timeframe chart such as 1min chart. Swing traders and high timeframe do not impact this much. A trader should do his or her own research on all types of charts before trading in financial markets.


