Detailed Descriptions of Trailing Stop Methods in Ultimate Trailing Stop EA

Trailing Algorithm Settings: Detailed Descriptions

-
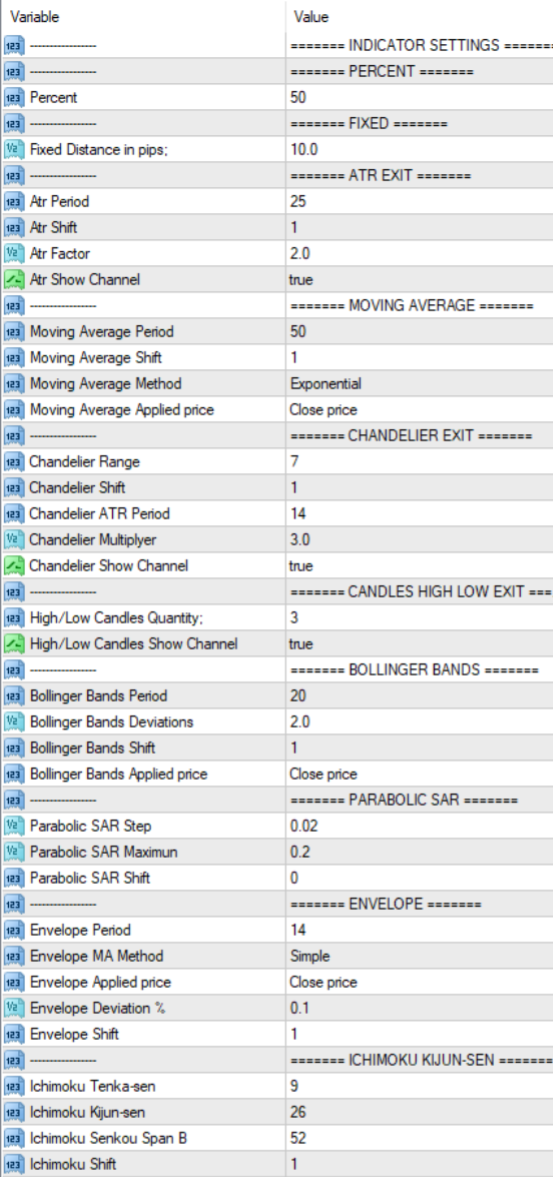
Percent. Trails at percent profit. Works best with Threshold in Pips. When price goes above the threshold in pips, the stop loss is set to protect a percentage of the profits till trade is closed.
-
Percent — the percent by which you want the EA to trail.
-
Fixed. Trails at a fixed pip profit. Works best with Threshold in Pips. When price goes above the threshold in pips, the stop loss is set a fixed distance below close and follows close till stop loss is hit.
-
Fixed distance in pips — the fixed distance to set the SL below close.
-
ATR Exit. It uses close + ATR value to draw trailing stop lines (orange under buys, magenta over sells) that advance with the trend until the trend changes direction. It uses a multiple of the Average True Range (ATR), subtracting it’s value from the close on buy, adding its value to the close on sell. Moreover, the trailing stop lines are generated to support the order’s trend direction (long or short):
-
ATR period — indicator period.
-
ATR shift — indicator shift.
-
ATR multiplier — ATR value multiplier.
-
ATR Show Channel — if set to true, it will work on Channel Mode, SL lines on both sides of price. If set to false, it will work in Trend Mode, SL lines in direction of trend. Default is true.
-
Important Note: In order to use visualize the ATR on the chart when using Apply Indicator Template=true, you need to download our free ATR Exit indicator (for MT4 or MT5)
-
Note: When "ATR Show Channel" is set to false (Trend Mode), the trailing stop loss may not be assigned if the closing price for a buy trade is below the ATR line (or above the ATR line for a sell trade). This is because there is no ATR line to support the stop loss in such cases. When "ATR Show Channel" is set to true (Channel Mode), the stop loss lines will be placed on both sides of the price, ensuring that a stop loss is always visible.
- Moving Average. Stop loss follows the moving average.
-
Moving Average Period — indicator period.
-
Moving Average Shift — indicator shift.
-
Moving Average Method — indicator method.
-
Moving Average Applied Price — indicator applied price.
-
Note: The trailing stop loss may not be assigned if the closing price for a buy trade is below the moving average line (or above the moving average line for a sell trade). This is because there is no moving average line to support the stop loss in such cases. The stop loss will only be present if the closing price for a buy trade is above the moving average line (or below for a sell trade).
- Chandelier Exit. It uses Highest High/Lowest Low of Range + ATR value to draw trailing stop lines (orange under buys, magenta over sells) that advance with the trend until the trend changes direction. It uses a multiple of the Average True Range (ATR), subtracting it’s value from the close on buy, adding its value to the close on sell. Moreover, the trailing stop lines are generated to support the order’s trend direction (long or short):
- Chandelier Range — the range of the highest high or lowest low
- Chandelier Shift — indicator shift.
- Chandelier ATR Period — ATR indicator period.
- Chandelier Multiplier — ATR value multiplier.
- Chandelier Show Channel — if set to true, it will work on Channel Mode, SL lines on both sides of price. If set to false, it will work in Trend Mode, SL lines in direction of trend. Default is true.
- Important Note: In order to use visualize the ATR on the chart when using Apply Indicator Template=true, you need to download our free Chandelier Exit indicator (for MT4 or MT5)
- Note: When "Chandelier Show Channel" is set to false (Trend Mode), the trailing stop loss may not be assigned if the closing price for a buy trade is below the Chandelier line (or above the Chandelier line for a sell trade). This is because there is no Chandelier line to support the stop loss in such cases. When "Chandelier Show Channel" is set to true (Channel Mode), the stop loss lines will be placed on both sides of the price, ensuring that a stop loss is always visible.
-
Candle High Low Exit. It uses the highest high and the lowest low of a range to draw trailing stop lines (orange under buys, magenta over sells) that advance with the trend until the trend changes direction. Moreover, the trailing stop lines are generated to support the order’s trend direction (long or short):
-
High / Low Candles Quantity — the number of bars back to calculate the lowest low and highest high.
-
High / Low Candles Show Channel — if set to true, it will work on Channel Mode, SL lines on both sides of price. If set to false, it will work in Trend Mode, SL lines in direction of trend. Default is true.
-
Important Note: In order to use visualize the Candle High Low Exit on the chart when using Apply Indicator Template=true, you need to download our free Candle High Low Exit indicator (for MT4 or MT5)
-
Bollinger Bands. Stop Loss follows the Bollinger Bands, lower band trailing longs, upper band shorts.
-
Bollinger Bands Period — indicator period.
-
Bollinger Bands Deviation — indicator deviation.
-
Bollinger Bands Shift — indicator shift.
-
Bollinger Bands Applied Price — indicator applied price.
- Note: The trailing stop loss may not be assigned if the closing price for a buy trade is below the lower Bollinger Band (or above the upper Bollinger Band for a sell trade). This is because there is no Bollinger Band to support the stop loss in such cases. The stop loss will only be present if the closing price for a buy trade is above the lower Bollinger Band (or below for a sell trade).
-
Parabolic. Stop loss follows the Parabolic SAR.
-
Parabolic SAR Step — indicator shift.
-
Parabolic SAR Maximum — indicator maximum.
-
Parabolic SAR Shift — indicator shift.
- Note: The trailing stop loss may not be assigned if the Parabolic SAR points are not positioned below the price for a buy trade (or above the price for a sell trade). This is because the Parabolic SAR only provides support for the stop loss when its points are correctly placed relative to the trade direction. Therefore, the stop loss will only be present if the Parabolic SAR points are below the price for a buy trade (or above for a sell trade).
-
Envelope. Stop loss follows the Envelope bands.
-
Envelope Period —indicator period.
-
Envelope MA Method —indicator method.
-
Envelope Applied Price —indicator applied price.
-
Envelope Deviation % —indicator deviation percentage.
-
Envelope Shift —indicator shift.
-
Note: The trailing stop loss may not be assigned if the closing price for a buy trade is below the lower envelope band (or above the upper envelope band for a sell trade). This is because there is no envelope band to support the stop loss in such cases. The stop loss will only be present if the closing price for a buy trade is above the lower envelope band (or below the upper envelope band for a sell trade).
-
Ichimoku Kijun-Sen. Stop loss follows the blue Ichimoku Kijun-Sen line.
-
Ichimoku Tenka-Sen — Tenka period.
-
Ichimoku Kijun-Sen — Kijun-Sen period.
-
Ichimoku Senkou Span B — Senkou Span B period.
-
Note: The trailing stop loss may not be assigned if the closing price for a buy trade is below the Kijun-Sen line (or above the Kijun-Sen line for a sell trade). This is because there is no Kijun-Sen line to support the stop loss in such cases. The stop loss will only be present if the closing price for a buy trade is above the Kijun-Sen line (or below for a sell trade).


-
Fractals. Stop loss follows the fractals. Fractals under bars trail longs and over bars trail shorts. No parameters.
-
Note: The trailing stop loss may not be assigned if there are no recent fractals positioned below the price for a buy trade (or above the price for a sell trade). This is because the fractals must be in the correct position relative to the trade direction to support the stop loss. Therefore, the stop loss will only be present if there are fractals below the price for a buy trade (or above for a sell trade).
-
Alligator. Stop loss follows the jaw, teeth or lips of the Alligator indicator.
-
Alligator Jaw Period — Jaw period.
-
Alligator Jaw Shift — Jaw shift.
-
Alligator Teeth Period — Teeth period.
-
Alligator Teeth Shift — Teeth period.
-
Alligator Lips Period — Lips period.
-
Alligator Lips Shift — Lips shift.
-
Alligator Averaging method — Indicator averaging method.
-
Alligator Applied price — Indicator Applied Price.
-
Alligator Line — Dropdown for preferred line to trail: Jaw (Default), Teeth, Lips
-
Alligator Shift — Indicator Shift.
-
Note: The trailing stop loss may not be assigned if the closing price for a buy trade is below the selected Alligator line (Jaw, Teeth, or Lips) or above for a sell trade. This is because there is no Alligator line to support the stop loss in such cases. The stop loss will only be present if the closing price for a buy trade is above the selected Alligator line or below for a sell trade.
- Close After X Minutes. As the name suggests, it allows you to close any of your controlled trades after a custom amount of minutes.
- Minutes — After selecting dropdown "Trailing Stop Method = Close After X Minutes," configure the # of minutes when your controlled trades will close out.
- Note: When using the "Close After X Minutes" method, no traditional stop loss (SL) will be visible on the chart. The trades will be closed automatically after the specified amount of time has elapsed, regardless of their price movement.
- Close After X Bars. As the name suggests, it allows you to close any of your controlled trades after a custom amount of bars.
- Bars — After selecting dropdown "Trailing Stop Method = Close After X Bars," configure the # of bars when your controlled trades will close out.
- Note: When using the "Close After X Bars" method, no traditional stop loss (SL) will be visible on the chart. The trades will be closed automatically after the specified number of bars has elapsed, regardless of their price movement.
- RSI. Stop loss follows the level line of RSI.
- RSI Period — indicator period.
- RSI Level — indicator level line, starting at 0, which is 50. Level=5 means that the RSI need to cross the level 45 to exit a long or 55 to exit a short.
- Note: The trailing stop loss is assigned based on the RSI level crossing the specified threshold. For a buy trade, the stop loss will be assigned if the RSI level crosses below the specified level (e.g., 45 if the level is set to 5). For a sell trade, the stop loss will be assigned if the RSI level crosses above the specified level (e.g., 55 if the level is set to 5). The stop loss will only be present if these conditions are met.
- Stochastic. Stop loss follows the level line of Stochastic.
- Stochastic %K Period— averaging period (bars count) for the %K line calculation.
- Stochastic %D Period -averaging period (bars count) for the %D line calculation
- Stochastic Slowing - slowing value, which is the main input for optimization
- Stochastic Level — indicator level line, starting at 0, which is 50. Level=5 means that the Stochastic need to cross the level 45 to exit a long or 55 to exit a short.
- Note: The trailing stop loss is assigned based on the Stochastic level crossing the specified threshold. For a buy trade, the stop loss will be assigned if the Stochastic level crosses below the specified level (e.g., 45 if the level is set to 5). For a sell trade, the stop loss will be assigned if the Stochastic level crosses above the specified level (e.g., 55 if the level is set to 5). The stop loss will only be present if these conditions are met.


