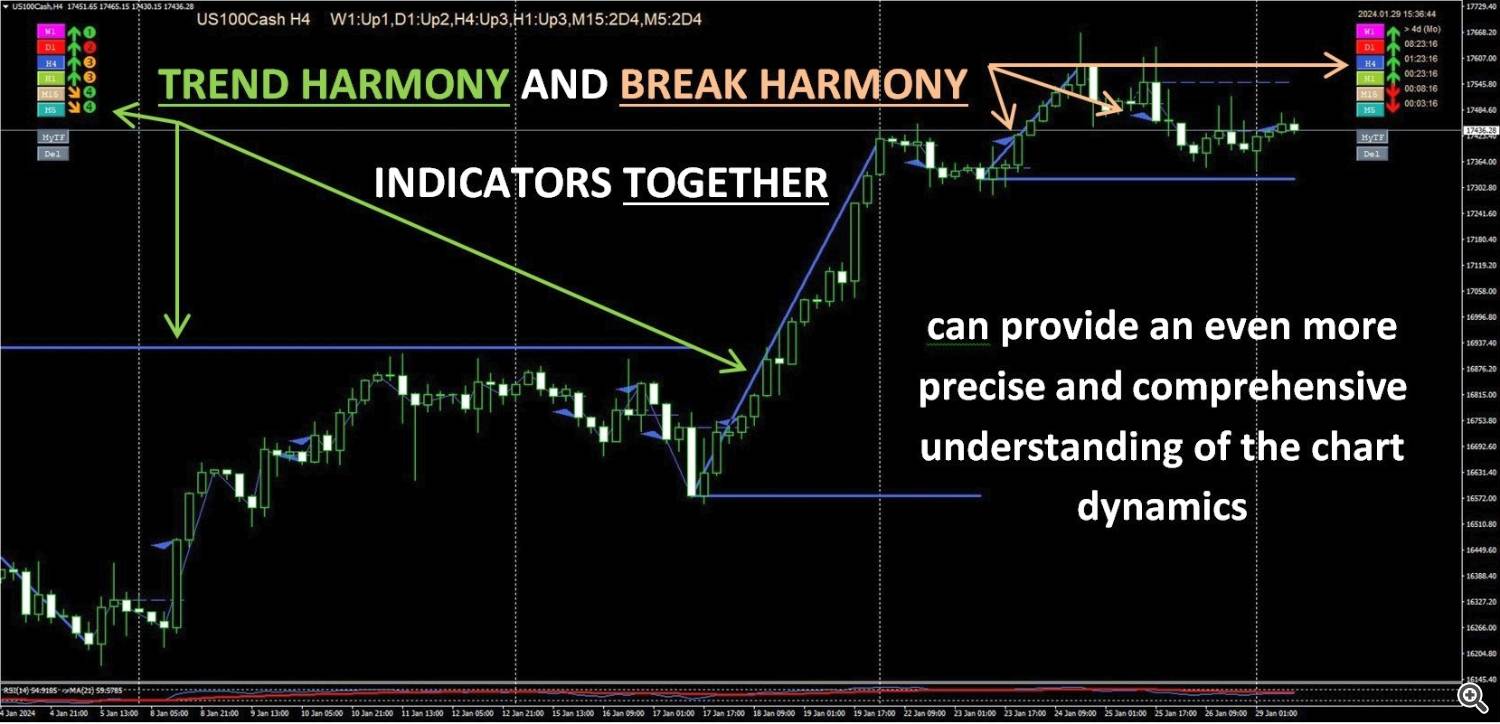
The BreakHarmony Multi-Timeframe Breakout Indicator is an advanced tool for MT4 and MT5. It helps traders by showing breakout points across different timeframes, aiding decision-making and understanding market movements.
But what are breakouts?
A breakout occurs when the price of a trading instrument surpasses a resistance level or falls below a support level. Breakouts suggest the potential for the price to start a trend in the breakout direction. For instance, an upward breakout from a chart pattern may suggest an upcoming uptrend.
However, it must be admitted that Breakouts can be subjective since not all traders will recognize or use the same support and resistance levels, Breakouts provide possible trading opportunities. A breakout to the upside signals traders to possible get long or close short positions. A breakout to the downside signals traders to possibly get short or to close long positions.
Breakouts with high volume, or with a marubozu candle indicate stronger conviction or interest and a higher likelihood of the price continuing in that direction. Breakouts on low relative volume or interest are more prone to failure, so the price is less likely to trend in the breakout direction.
How does the BreakHarmony indicator help with all this?
The BreakHarmony Multi-Timeframe Indicator indicates breakout prices with the closing price of the candle and shows the broken resistance and support level with horizontal line at the candle has been broken.
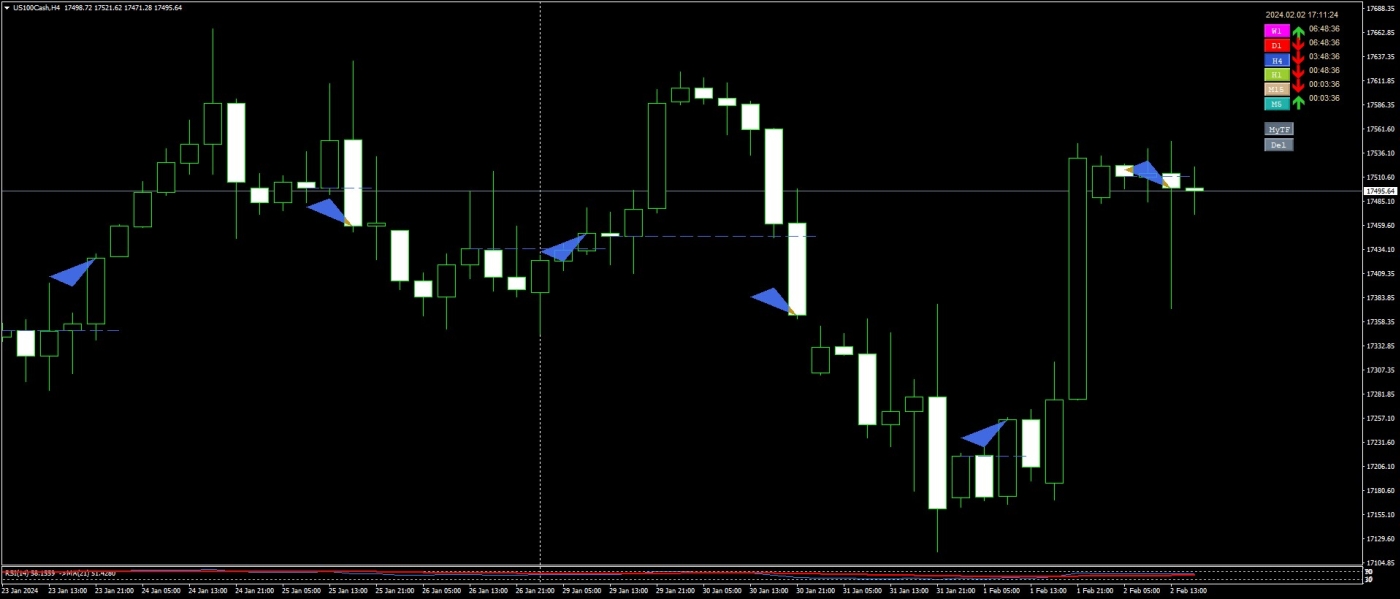
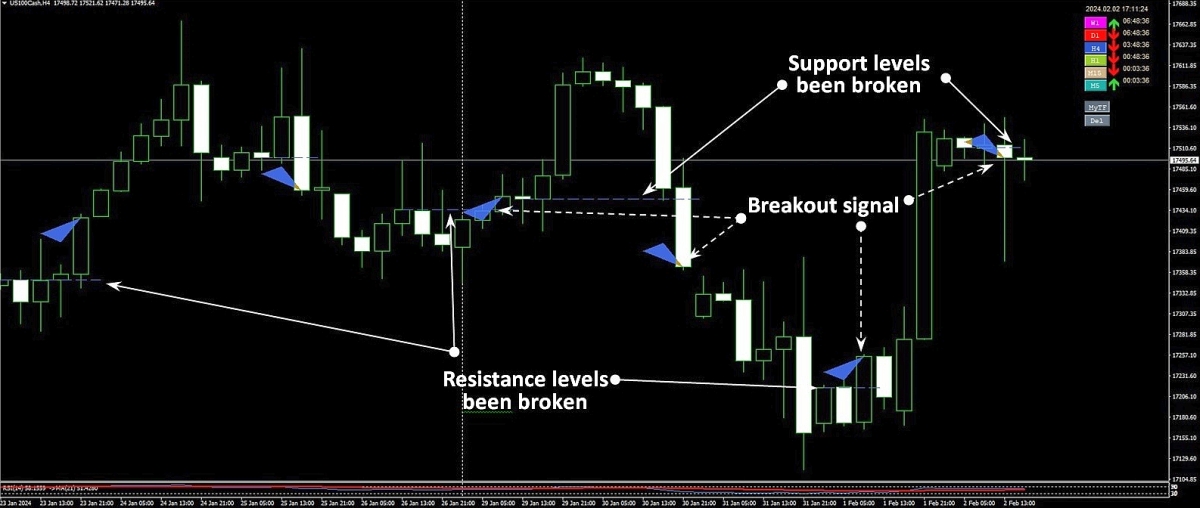
The result of the analysis for each timeframe is summarized in an info panel, that shows the prevailing breakout or breakdown direction on each analyzed timeframe giving traders a quick overview of the market situation.
The indicator also displays the time remaining until the current candle closes on each timeframe, helping traders react to market events in a timely manner and optimize their trading strategies based on the remaining time horizon.
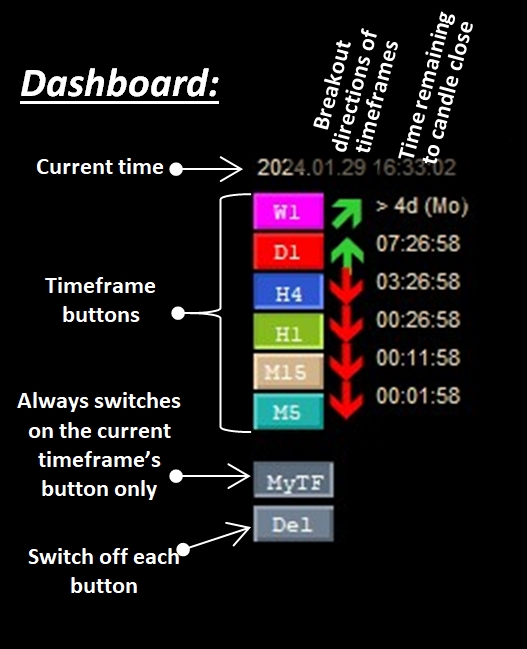
The indicator provides information on potential breakouts before the candle closes. A directional arrow gradually shifts towards the anticipated breakout direction as the candle approaches its closure, offering insight into likely market direction beforehand. This dynamic forecasting element adds a predictive dimension to the tool, enhancing its usability for traders seeking a proactive approach to market analysis.
Combining an intuitive interface with detailed information, the indicator allows efficient navigation across different timeframes, enhancing the likelihood of successful trading decisions.
When combined with the Trend Harmony indicator (MT4 version, MT5 version), it provides a more precise understanding of chart dynamics by integrating trend analysis with breakout signals. The Trend Harmony identifies prevailing trends and trend phases, and the Break Harmony points out critical breakout points, allowing traders to align strategies with both the broader trend and potential breakout opportunities.
How BREAK HARMONY Multi-Timeframe Indicator Empowers You
Time-Saving: Streamline your analysis process by showing breakouts on multiple timeframes at a glance. The indicator works on any trading instrument and timeframe.
Historical Reference Lines: Highlights past significant breakout and broken prices on each timeframe.
Trend Continuation / Reversal Projection: Anticipate trend continuation or trend reversal by identifying breakouts in the given trend and trend phase in advance. (A prerequisite is to be aware of the direction of the trend and the current phase at the breakout points. Trend Harmony indicator can help in it.)
Sharp Timing: Due to the indicator's ' breakout prediction arrow' and 'candle close time remaining' features traders can get ahead of the crowd by achieving a better trade open price or a trade close price.
How It Guides Your Trading Journey
- Instrument prioritization:
The BREAK HARMONY indicator assists in prioritise financial instruments where breakouts show in the same direction at each timeframe. So helps to go for trades with a higher probability of significant winnings.
- Breakout identification:
From the fluctuations in the price waves, it identifies points where the breakout directions change. At these points, the Break Harmony indicator draws the resistance or support lines that have been broken, and marks the candles that broke through them and show the new direction. Naturally, the longer the timeframe, the more significant the market considers the change in direction.
- Breakout prediction:
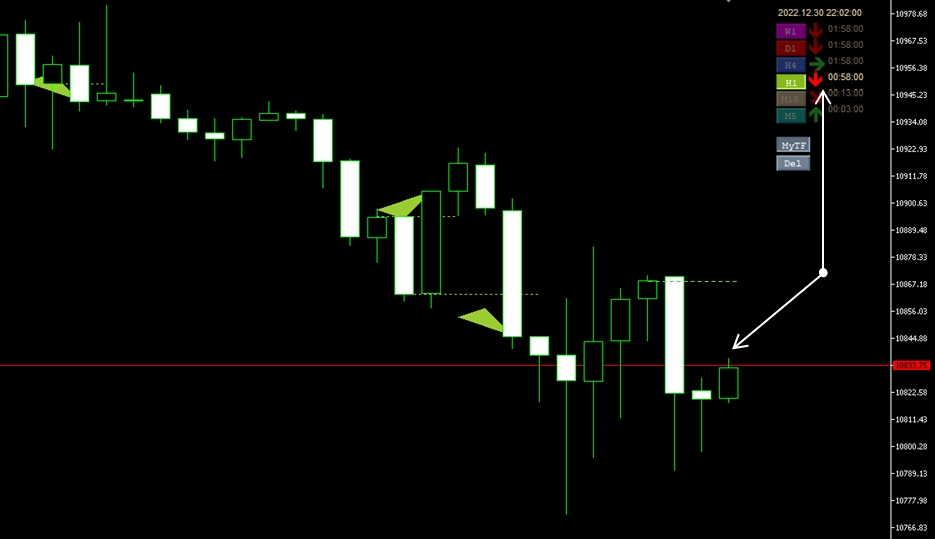
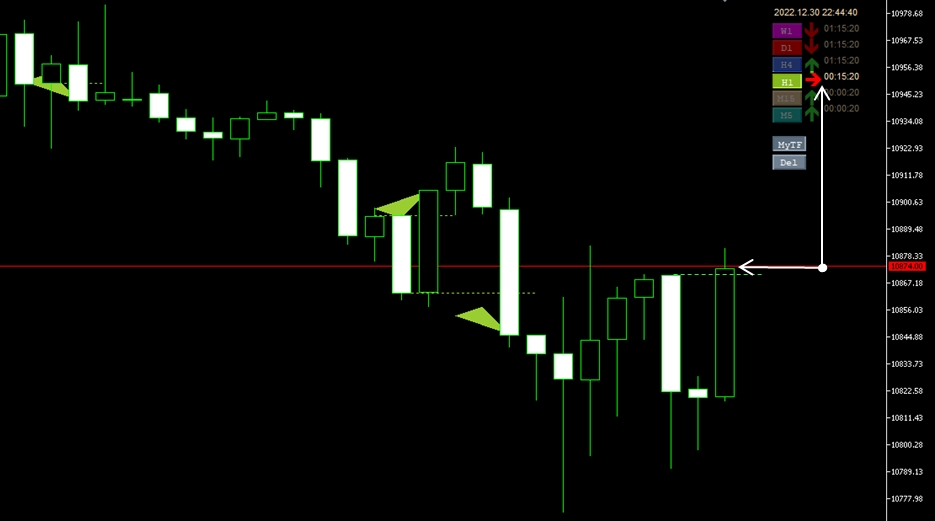
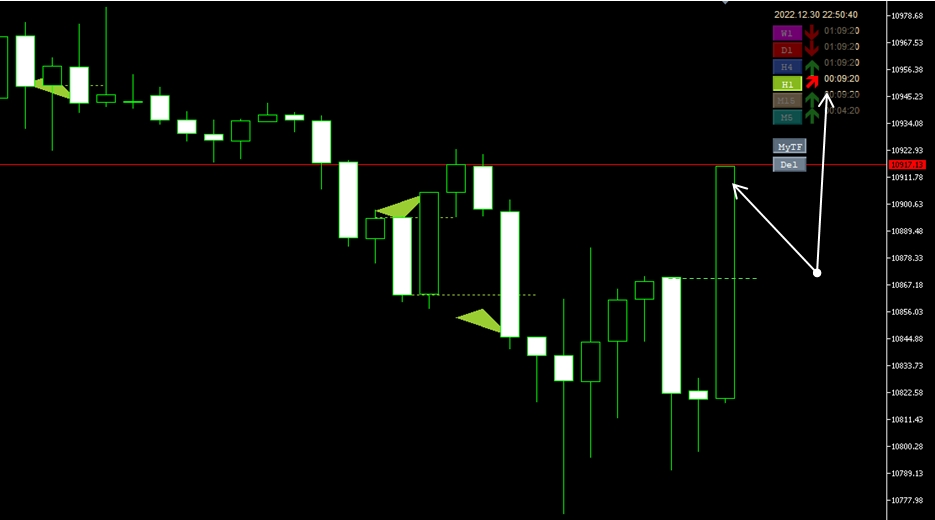
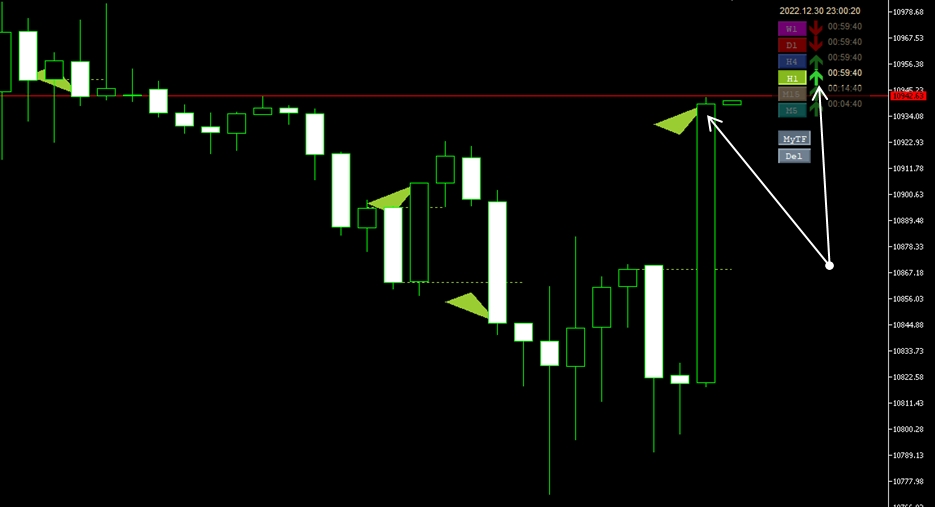
In the price chart, triangles indicate breakouts, they appear only after the candle closure, while on the info panel breakouts are signaled in advance, before the closure of the candle for the respective timeframe, if the breakout is expected to occur. As we approach the closure of the candle, the arrow in the corner gradually shifts to indicate the anticipated breakout direction.
If the last breakout was upward, and there is no indication of a breakout above the highest support level on the current timeframe, the indicator displays ![]() arrow at its timeframe.
arrow at its timeframe.
When the current price gets below the support level of the current timeframe but its period has not yet reached its half time (e.g. first 2 hours of the H4 candle; or first 30 minutes of the H1 candle), the signal changes to ![]() .
.
If the current price gets or is below the support level of the current timeframe and the remaining time is between its half and the last quarter of the given timeframe, the signal changes to ![]() indicating that the probability of breakout to downwards increased.
indicating that the probability of breakout to downwards increased.
Once the current price gets or is below the support level of the current timeframe and the candle of the given timeframe has already reached the last quarter of its period, the signal changes to ![]() , indicating that the probability of breakout to downward increased further, but green color still suggests that the support level has definitelly not yet broken.
, indicating that the probability of breakout to downward increased further, but green color still suggests that the support level has definitelly not yet broken.
Finally if the given candle closes below the prior valid support level the signal changes to ![]() , indicating that the breakout already happened downwards and suggest an upcoming downtrend.
, indicating that the breakout already happened downwards and suggest an upcoming downtrend.
But if the price is pulled back above the support level by the time of candle closure the signal changes back to ![]() . The downward breakout was unsuccessful.
. The downward breakout was unsuccessful.
it works the same way in the opposite direction. So, signal is ![]() until the price does not go above the valid resistance level. If the price goes above it and the remaining time is more than the half of the given timeframe it changes to
until the price does not go above the valid resistance level. If the price goes above it and the remaining time is more than the half of the given timeframe it changes to ![]() . If the price is still above or goes above the resistance level when the candle's remaining time is less than the half of it but more than the quarter of it it changes to
. If the price is still above or goes above the resistance level when the candle's remaining time is less than the half of it but more than the quarter of it it changes to ![]() . If remaining time is less than the quarter to its closure the signal changes to
. If remaining time is less than the quarter to its closure the signal changes to ![]() ,
,
When the candle closed above the resistance level the arrow changes to green up ![]() , indicating that the breakout happened. But if the market could not break the resistance and the candle closed below it the arrow changes back to
, indicating that the breakout happened. But if the market could not break the resistance and the candle closed below it the arrow changes back to ![]() .
.
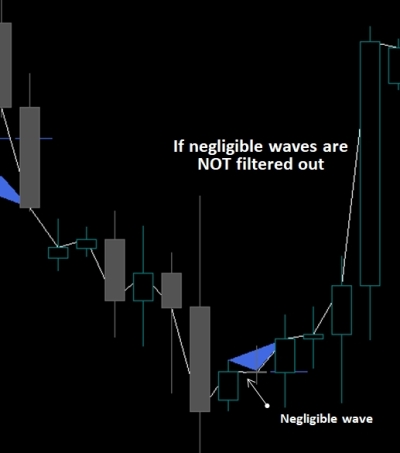
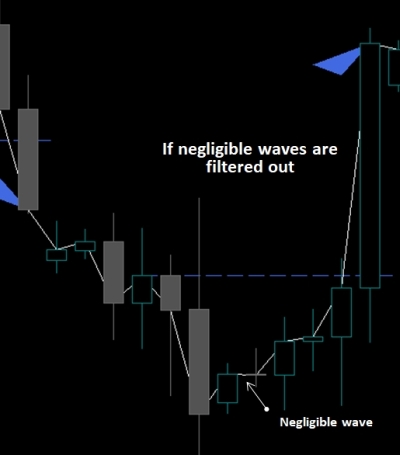
Filtering out too small, not significant waves and breakouts
As mentioned above breakouts can be subjective since not all traders will recognize or use the same support and resistance levels. Mainly the negligible levels will be ignored by the most traders.
So, the Break Harmony indicator provides three options for filtering out too small waves or negligible breakouts:
- You can filter out waves that are smaller than a given percentage of the previous wave's size. If the previous wave's last price movement was - let's say - 100 points up and the 'Small wave filter' parameter is set to 5% the indicator will ignore the current down (opposite) movement until it reaches 5 points. If the price goes higher again after only 4 points down movement the wave will not be considered as wave and as support level when the price later returns down from higher price levels.
- You can filter out breakouts that bearly broke the support and resistance levels. If the breakout candle closes just above the resistance level or just below the support level the indicator does not consider it as valid breakout until one of the subsequent candles closes higher than the specified limit. Two types of such breakout validation filter can be used in the indicator:
- 2.a. The 'Wave dependent breakout limit" parameter is a relative filter depending on the size of the current wave. In case of breakout of a resistance: if this parameter is set to 5 and the current wave's low was e.g. 100 points lower (it means that it was 100 points lower than the previous high, which is now the current resistence), and the breaking candles closes only 4 points higher than the resistance, the indicator will not consider it as a valid breakout until one of the consecutive candles closes higher than the Resitance level + 5 points.
- 2.b. The 'ATR dependent breakout limit" parameter is an ATR based relative filter depending on the ATR value (with averaging period of 14) at the time of the breakout moment. In case of breakout of a resistance: if this parameter is set to 10 and the ATR(14) value of the current timeframe is 100, and the breaking candles closes only 9 points higher than the resistance, the indicator will not consider it as a valid breakout until one of the consecutive candles closes higher than the Resitance level + 10 points.
Input parameters and default values:
TIMEFRAMES_TO_ANALYZE group enables the custumization of the 6 timeframes.
COLORS_OF_TIMEFRAMES group enables the custumization of the colors of the 6 timeframes.
HOW_MUCH_TIME_TO_ANALYSE GROUP enables to customize analysis periods to each timeframes. Please be aware that the first Timeframe is defined in Weeks, not in Days as the other timeframes.
In THRESHOLD_RELATED_PARAM section you can set parameters to filter out negligible waves and breakouts as described above in section 'Filtering out too small, not significant waves and breakouts'
In WHICH_TF_CHANGE_INTERESTED_IN section you can set wheter you want to get notifications or alerts if the given timeframe's breakout direction changes. By default the highest 4 timeframes are set as TRUE.
In ALERTS group you can set the way of communication of the indicator: Play Sound, Use Alert, Send Email or Send Notification; Additionally you can set the number of repetitions of a given change and the waiting time (Pause, in seconds) between notfications if you want to get reminders.
In OTHER_VISUAL_INPUTS group:
You can decide wheter to show current time and remaining time to each timeframe in the Info Panel or not.
You can set in Which corner do you want to place the info panel, and do you want to color control buttons or do you want to see them grey.
NOTE: BREAK HARMONY MTF Indicator is compatible with MetaTrader 4 and MetaTrader 5 and is designed to enhance, not replace, your trading strategy. Trade responsibly!
For MT4 Version: Click here.
For MT5 Version: Click here.
When combined with the Trend Harmony indicator (MT4 version, MT5 version), it provides a more precise understanding of chart dynamics by integrating trend analysis with breakout signals. The Trend Harmony identifies prevailing trends and trend phases, and the Break Harmony points out critical breakout points, allowing traders to align strategies with both the broader trend and potential breakout opportunities.
What do you think about it? Feel free to post your questions, opinion or comments below!
Thank you!
