If you spot a perfect streamline trend move, you need to analyse it to identify what makes it different from other moves.
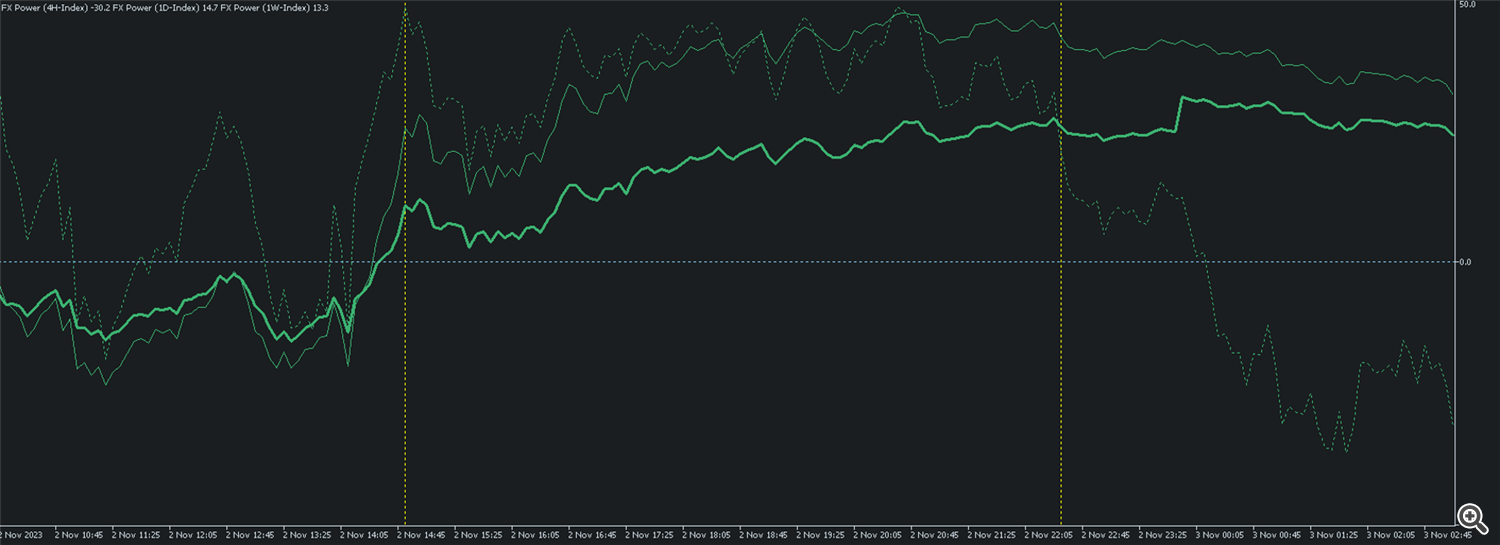
Yesterday we saw a perfect BUY trend move on the CAD, and so we analyse its line profile with FX Power NG,
which is available for MT4 👉 FX Power MT4 NG and MT5 👉 FX Power MT5 NG
and you'll find the corresponding chart templates for MT4 and MT5 at the end of this article.
This is the perfect trend line profile, starting with the first yellow dotted line as entry point.
1. All three lines are above the neutral zero level.
2. The dotted short-term 4H is above the straight 1D line
3. The 1D line is above the thick 1W line.
4. All three lines show some serious dynamic to the upside.
The second yellow dotted line marks the exit when the short-term 4H line drops through the 1W line.
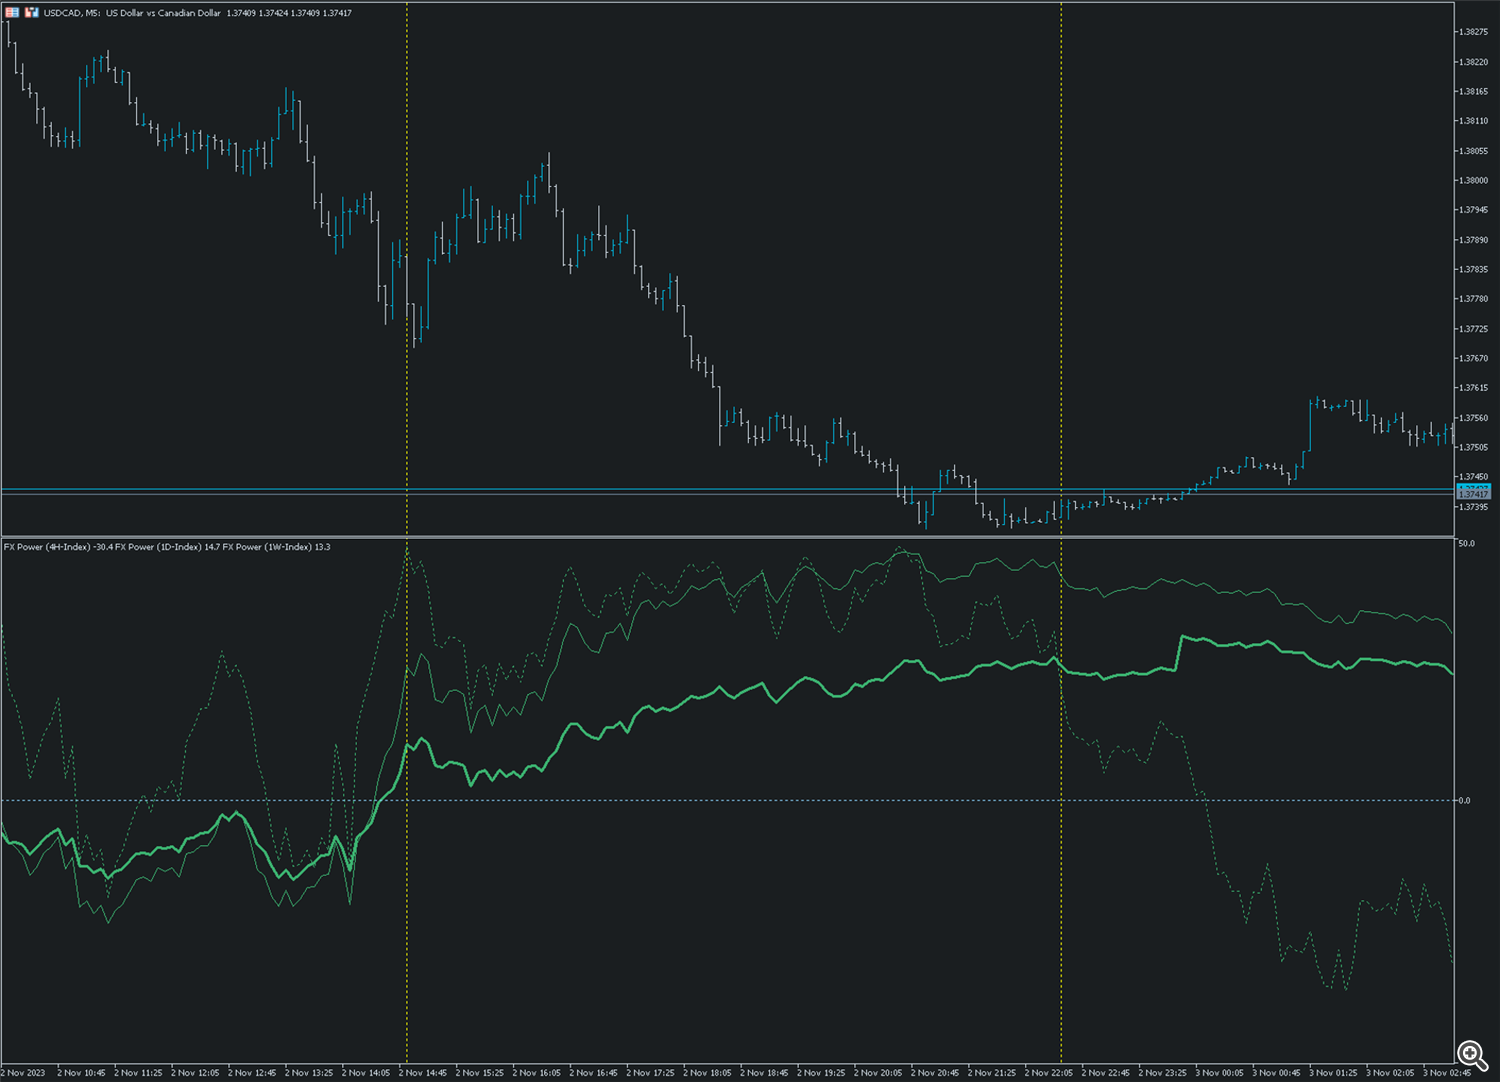
So let's see this line profile on the major CAD pair, USDCAD. -> Not spectacular, but the CAD BUY trend is obvious.
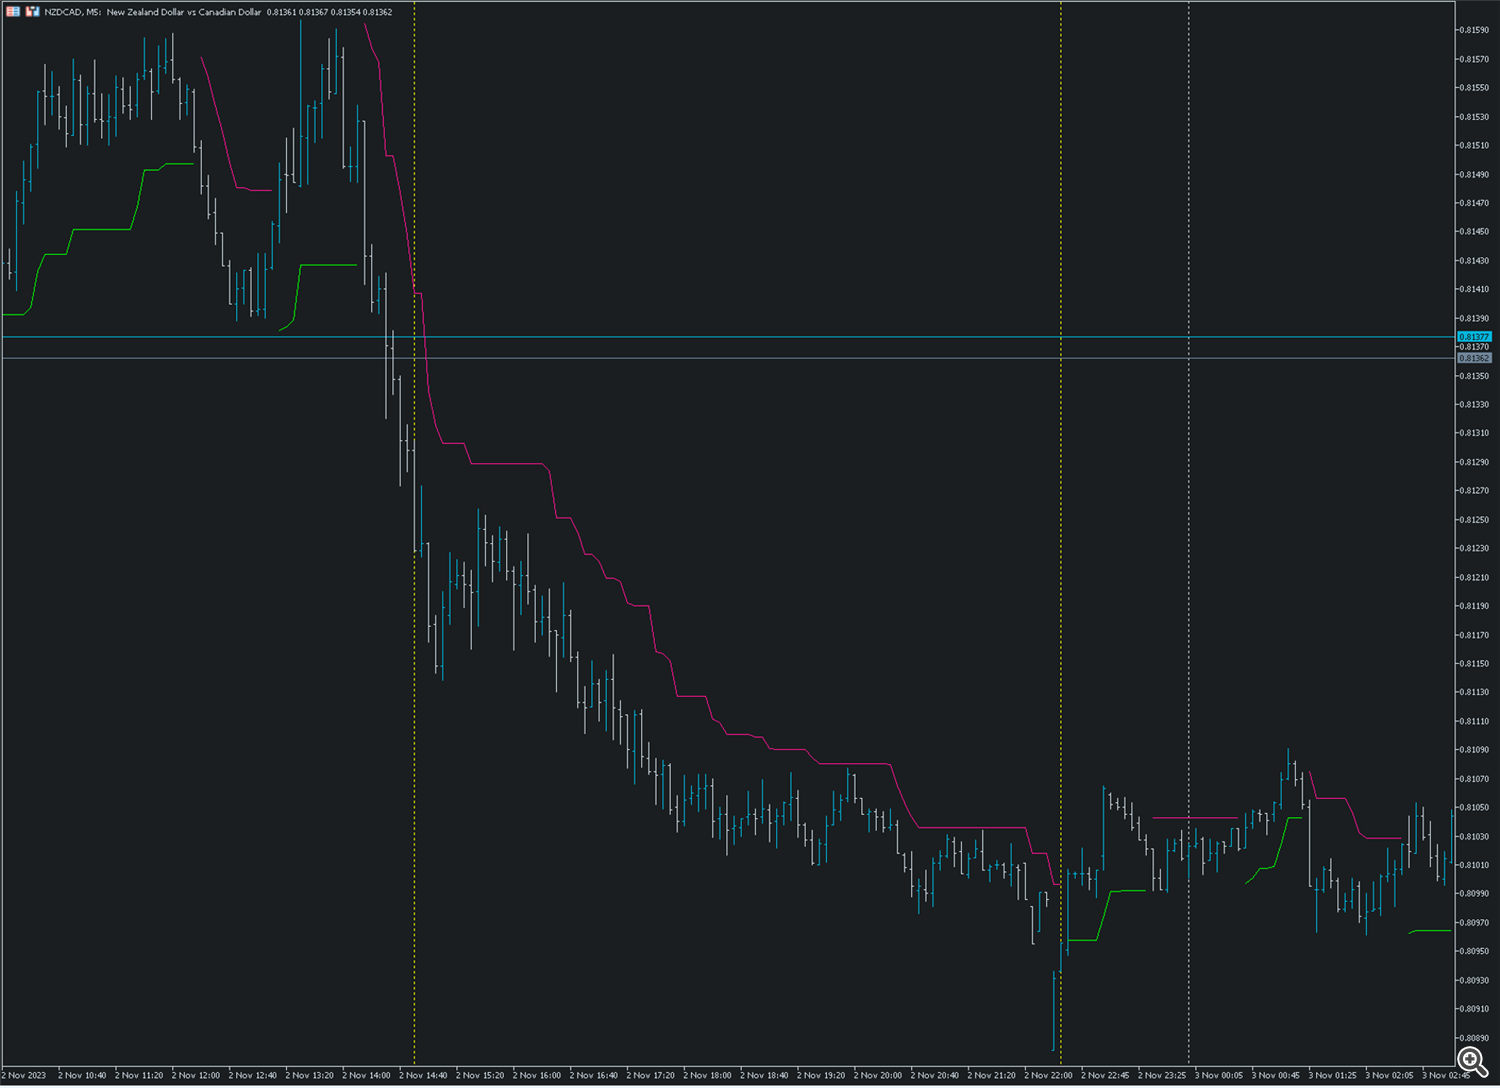
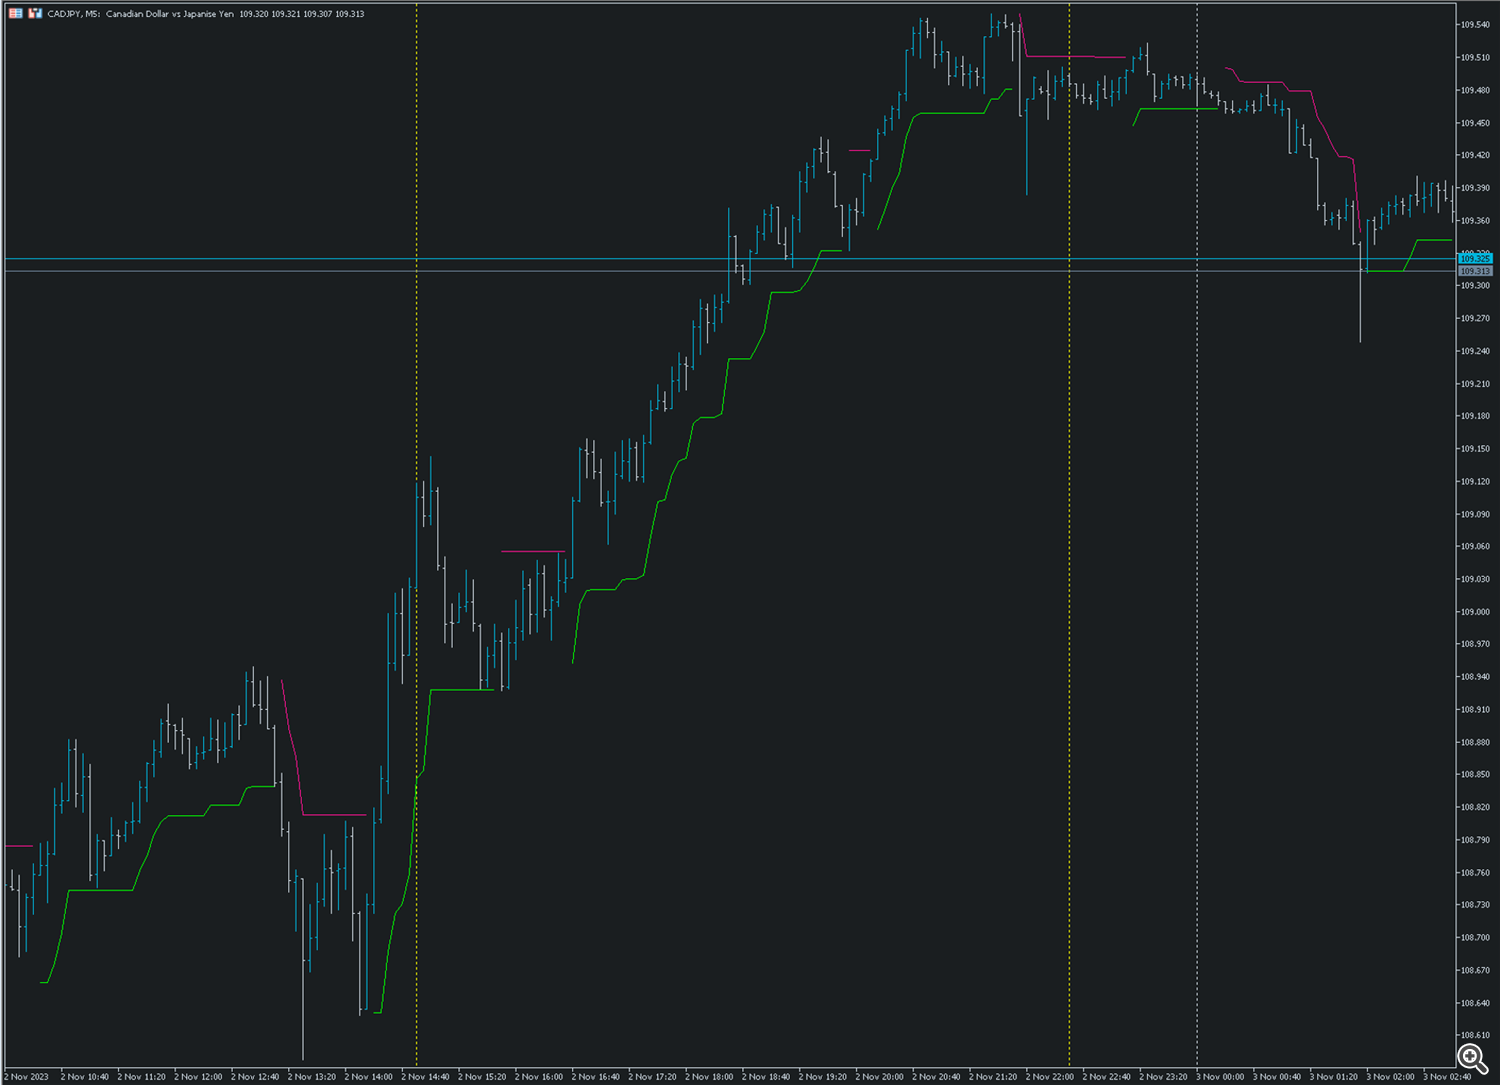
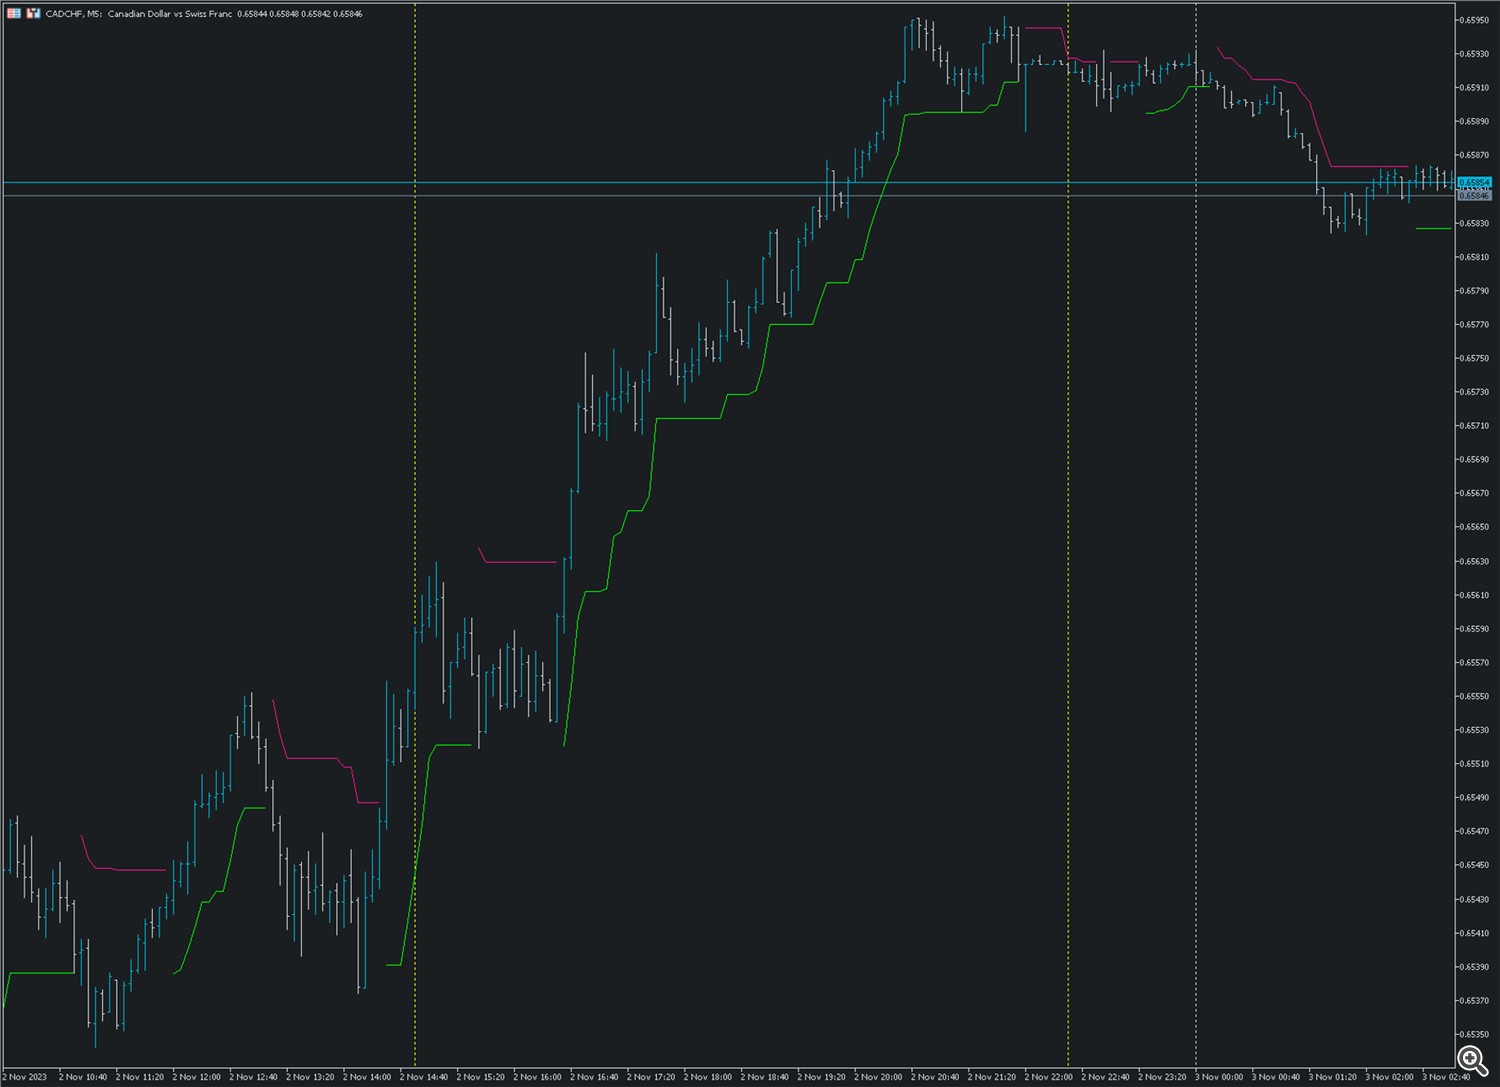
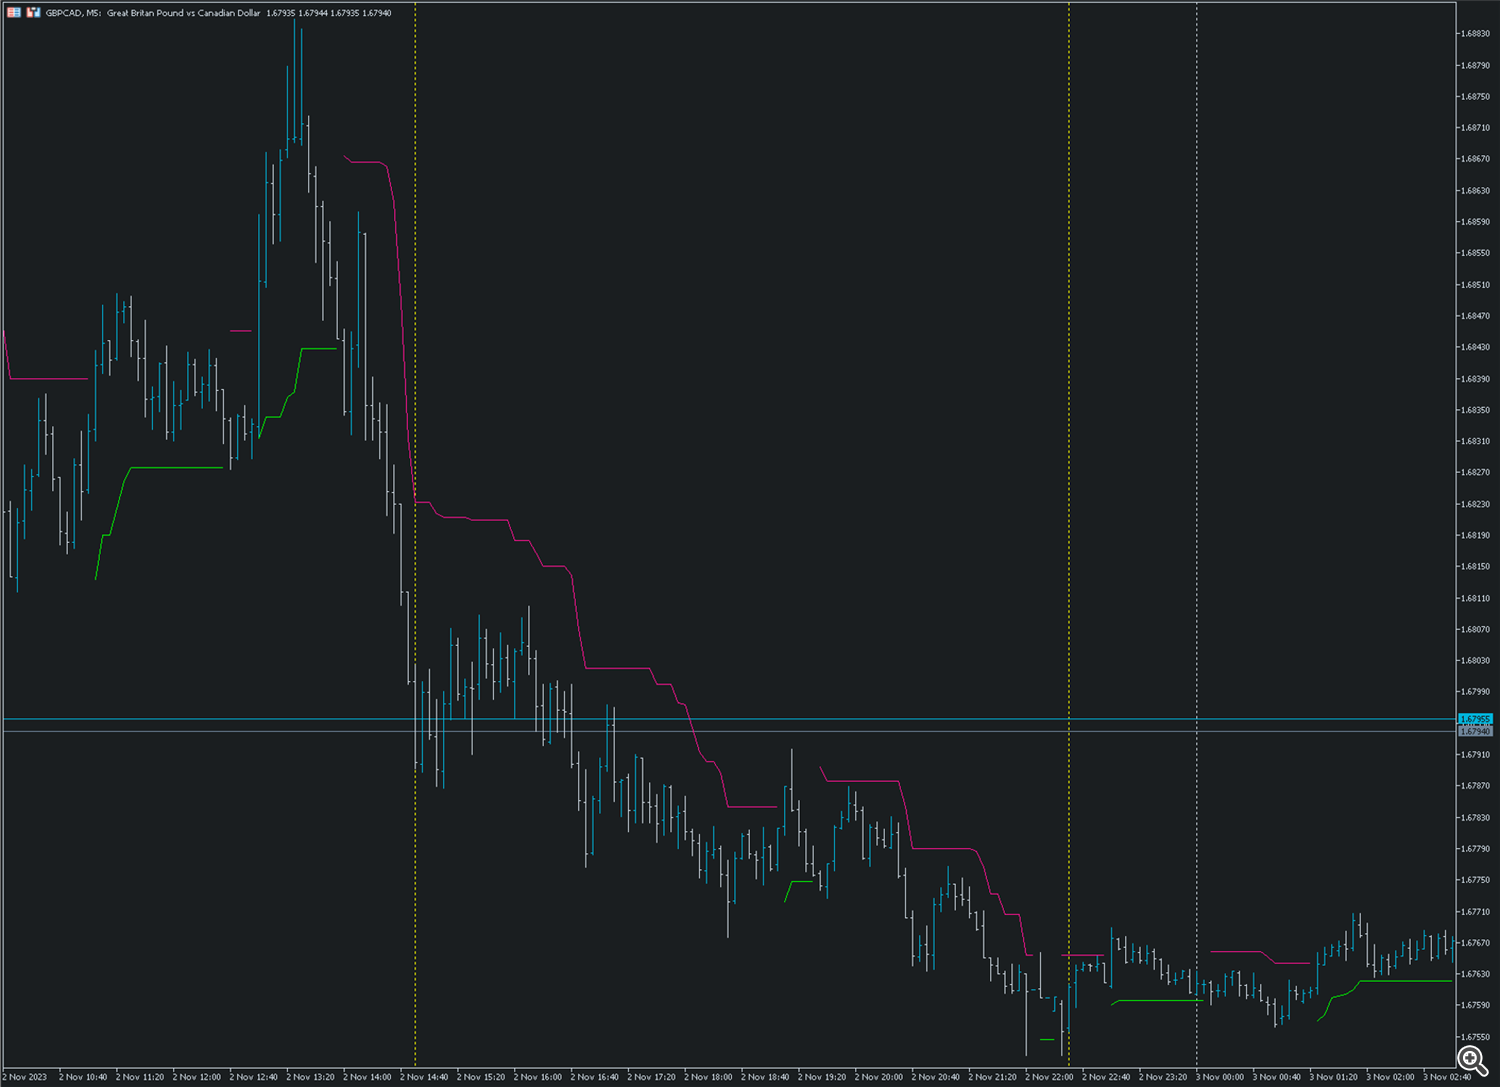
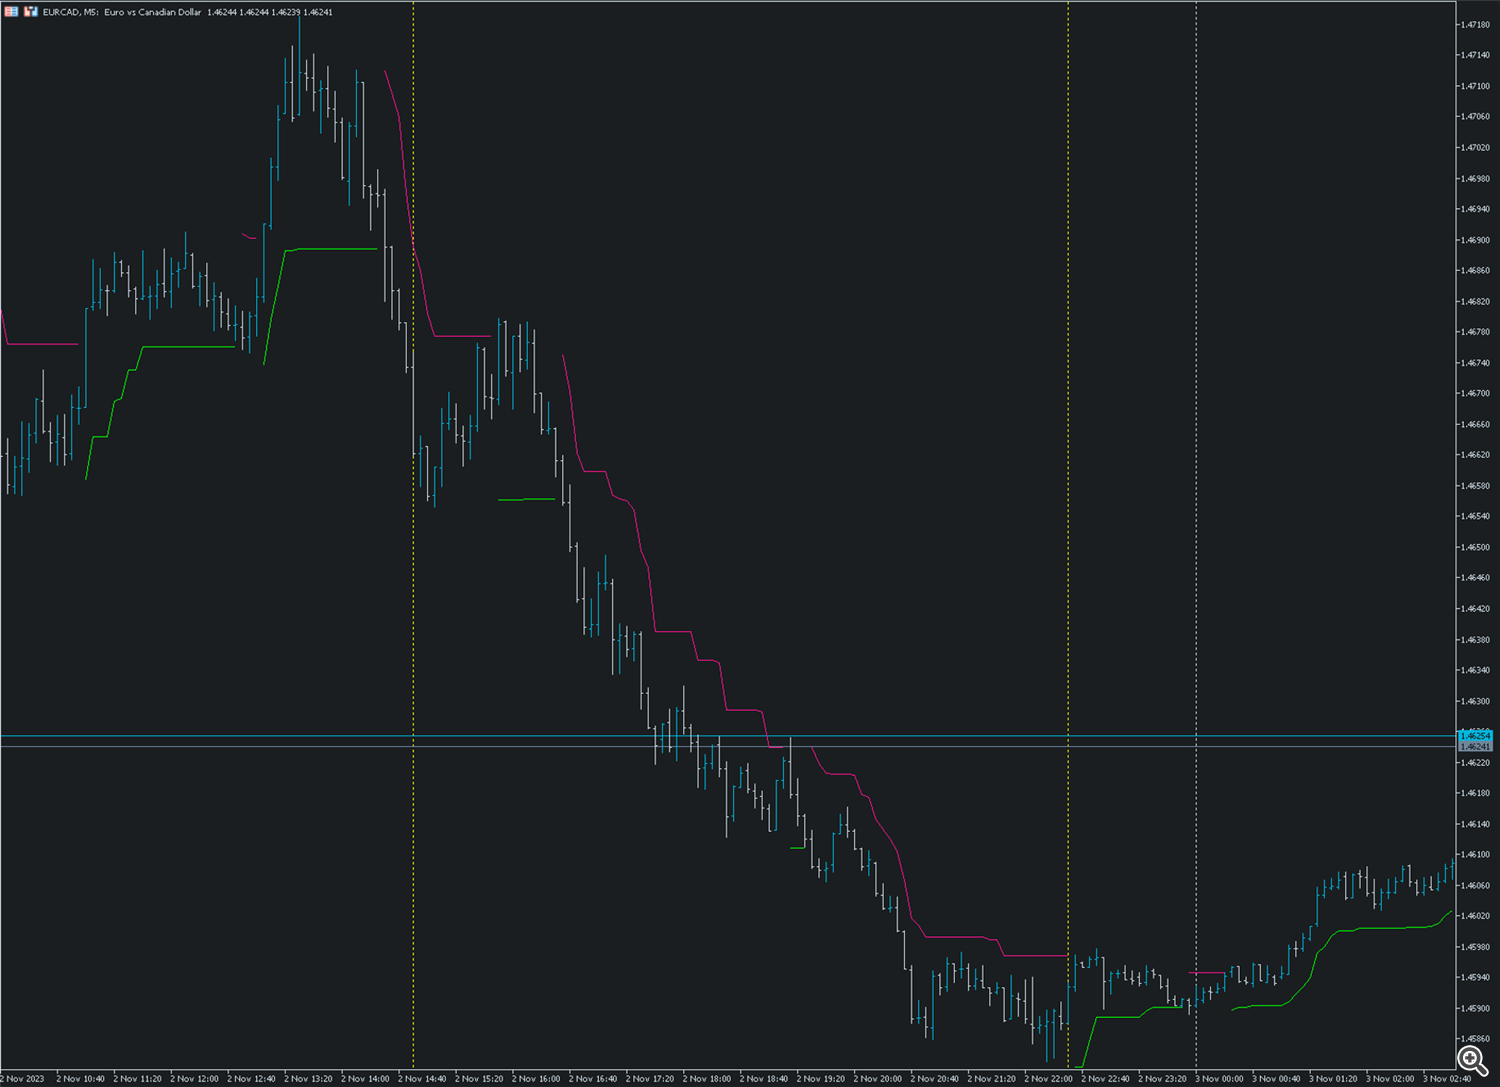
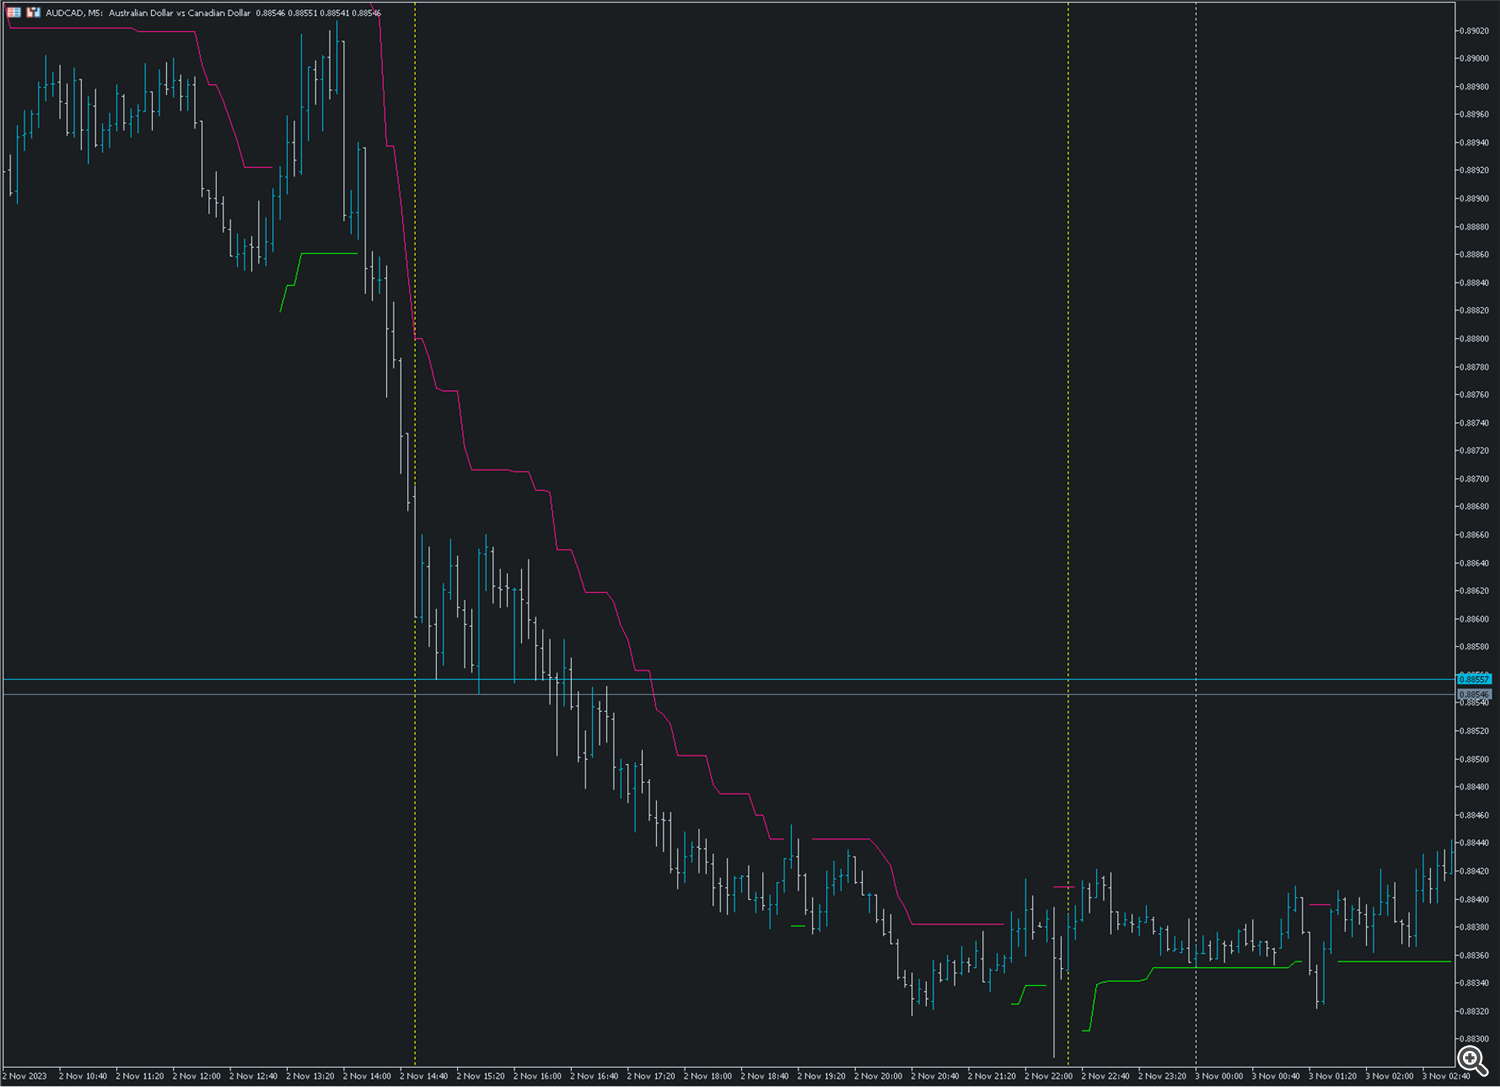
So what about the 6 other CAD pairs? That's where the real party started as you can see below.
NZDCAD
AUDCAD
CADJPY
CADCHF
GBPCAD
EURCAD
So, let's repeat what's the line profile we're looking for a BUY SETUP
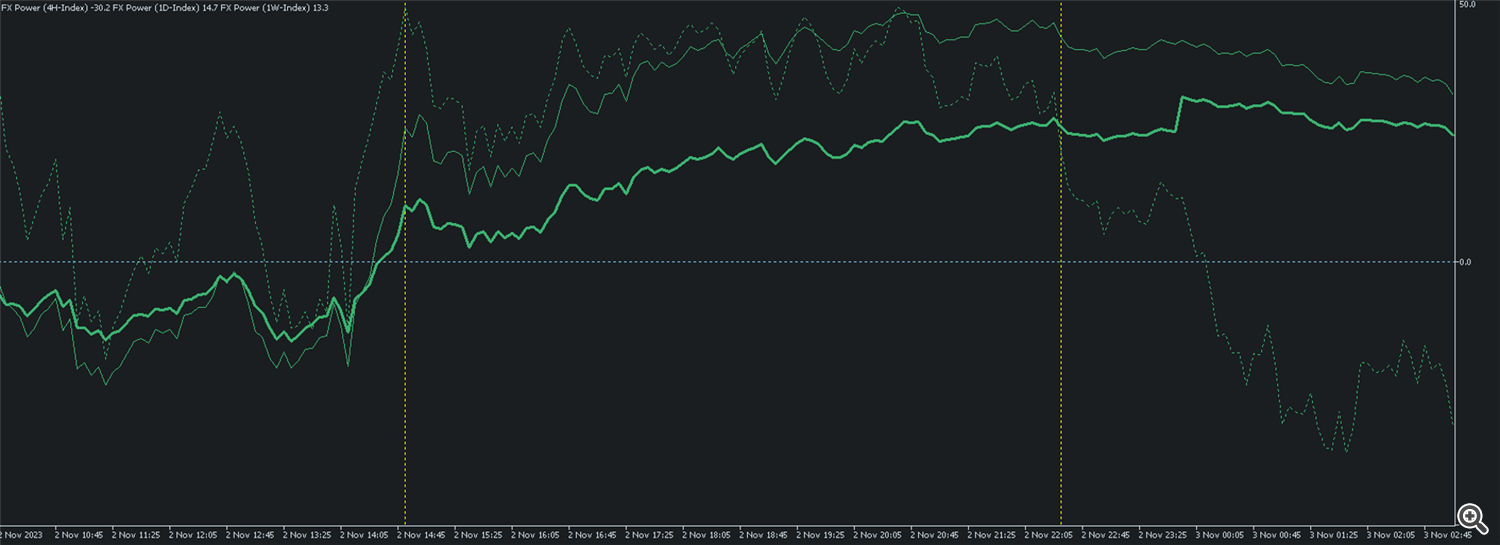
1. All three lines are above the neutral zero level.
2. The dotted short-term 4H is above the straight 1D line
3. The 1D line is above the thick 1W line.
4. All three lines show some serious dynamic to the upside.
For a SELL setup it's, of course, vice versa.
Here are some tutorial videos of how to create this beautiful indicator setup.
Step 1: Create the Triple Instance Setup
Step 2: Focus on what's relevant
Step 3: Define individual line styles
Step 4: Save chart space with our compact panel mode
Step 5: Use templates to duplicate the setup on other charts

