RSI Scanner product page
MT4 version here
MT5 version here
RSI Settings
Set the RSI period, Applied price plus signal levels and also the option to get an alert for price entering and exiting the overbought/oversold zone.
Signal after candle close: If true dashboard waits until the close of the current candle and then checks the signal.
Other settings:
Timeframes to scan (MT4 version): You can type the name of the timeframes (as shown in the MT4 toolbar) you want to monitor separated with an underline(underscore) "_" symbol. Reducing the number of timeframes for monitor reduces the calculations required and improves the dashboard performance.
Scan Interval (Millisecond): If the "Signal after candle close" option is set to false, this number sets the scan interval of the current candle of the symbols in milliseconds. Lower numbers put more load on the system CPU.
Alert Mode: Choose between 3 options for the alert system:
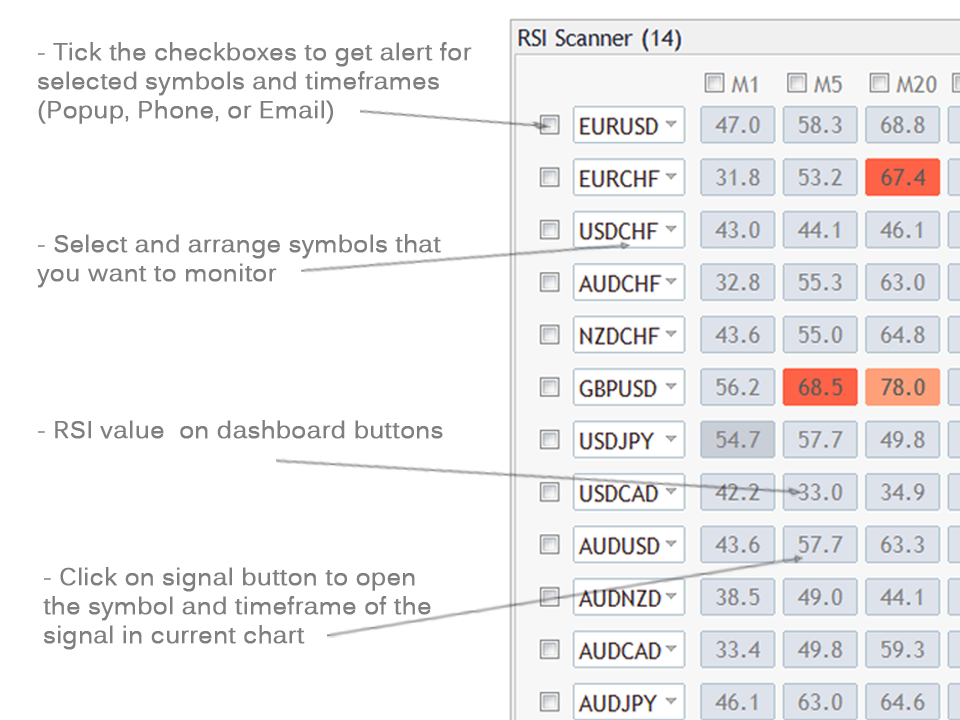
- Single symbol and timeframe: Tick the checkboxes near the symbol names and timeframes you want to get an alert for them. When a signal occurs in a chosen symbol and timeframes the indicator alerts.
- Multiple timeframes of a symbol: In this mode indicator only alerts when all chosen timeframes (ticked ones like above) of a symbol have the same signal(color).
- Multiple symbols in a timeframe: Similar to second mode but this time if all chosen symbols have the same signal in a chosen timeframe the indicator alerts.
Popup Alert: To enable Metatrader alert window informing dashboard signals on a symbol and timeframe. Select symbols and timeframes that you want to get alert for them by ticking their checkboxes on the panel.
Phone Notification: To receive indicator alerts on the cell phone. For this to work you must enable and fill in the MetaTrader push notification settings from the Notifications tab on the MetaTrader options dialog (ctrl+o).
Email Alert: To receive indicator alerts via email. For this to work you must enable and fill in the MetaTrader email settings from the Email tab on the MetaTrader options dialog (ctrl+o).
Template name for new chart: Enter the name of the template you want to apply to new charts opened by clicking on the "Open in new chart" button.
Dashboard Columns: Choose between 1 or 2 columns of symbols (14 or 28 symbols) in the dashboard.
Dashboard Rows: Choose the number of dashboard rows of symbols (1-14).
Panel Font Size: You can change the font size of labels and button info with this.
Unique ID: If you want to set and save different sets of symbols set a different id number (any number) for each of them. To do that first set the new id in the settings then change the symbols then save the chart as a template. Do not change symbols before changing the id because changes will be saved automatically to the current id number.
Timeframe Settings (MT5 version)
There are up to 9 timeframes for each symbol. For each timeframe you can choose from 21 default MT5 timeframes from the dropdown list. By selecting "current" for a timeframe you can disable that timeframe and reduce the number of timeframes in the dashboard. Reducing the number of timeframes for monitor reduces the calculations required and improves the dashboard performance.

The first time you run the indicator it might take a while to update history data and show signals.
If you are running the indicator on an older PC there are things that you can do to improve performance:
- Set "Max bars in chart" to 10000 or less in the Charts tab on the MetaTrader options dialog (ctrl+o).
- Reducing the number of timeframes as stated above in timeframe settings also improves performance.
- Reducing the number of symbols.
- Set the "Signal after candle close" option to true.
- In case you set the "Signal after candle close" option to "false", setting a higher number in the "Scan interval" option improves performance.


