TakePropips TradePad Pro includes a powerful trade manager, currency strength meter, account reporting tools, risk management tools, and more!
It is one of the most advanced forex trade manager and trade assistant that you will ever come across! It is the perfect solution for traders who wants a more efficient way of managing trade transactions.
The TradePad Pro works on all Forex pairs, Metals, Commodities, Indices, and Crypto.
Purchase, rent, or download strategy tester demo here: https://www.mql5.com/en/market/product/88698
Main Features
- Order Management dashboard to open market/pending trades.
- Risk management tools such as drawdown protection, profit protection, and automatic lot size calculation.
- Currency Strength Meter to detect the strength and weakness of major currencies.
- Account Report to show detailed statistics and performance of your trading account.
- Task Manager to automate tasks such as opening buy/sell orders, price alert, and closing trades.
- Drawdown protection to set a max limit of drawdown on your account to avoid further losses
- Profit protection to set a max limit of profit on your account to avoid overtrading
- One-click to close all trades in profit, close all loss, close all buy, close all sell, close all pending, and close all orders.
- One-click “Reverse” button to automatically close the selected order and then automatically open a new opposite order.
- Manual Grid Management for opening grid trades
- Hedge Order Management to allow hedging of trades (full hedging or partial hedging)
- Edit existing trades TP and SL and ability to quickly set SL to breakeven price.
- Stealth Mode which hides the value of your SL and TP to your broker.
- Trailing Stop Management to automatically reduce the size of your SL as the price moves closer to your target profit.
- Breakeven SL Management to automatically move SL to breakeven price once it hits your target
- Partial Close Management to partially take profits as the price moves closer to your main target profit. You can also partially close trades as the price moves closer to your stop loss.
- Pairs Performance Management shows the overall performance of each pair on your account.
- Trade History to show all past trade transactions and ability to plot trade history on the chart
- One-click trading to quickly open market order using Fast Buy and Fast Sell button
- Hotkeys for convenience of trading using keyboard shortcuts
- Supports all 28 popular forex pairs including Commodities, Crypto and Indices.
TradePad Pro Dashboard
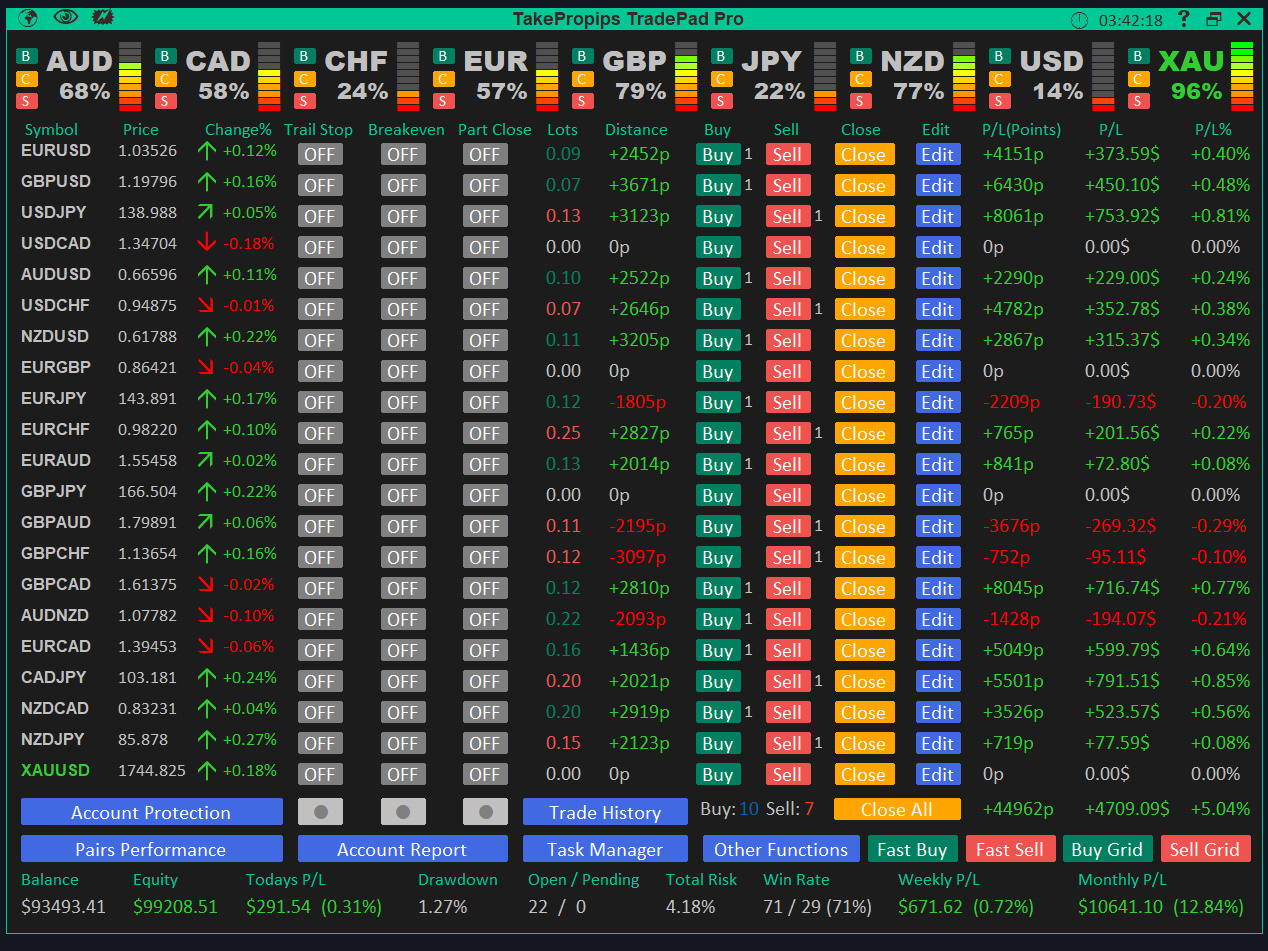
The TradePad Pro Dashboard includes the trade manager, currency strength meter, account statistics, and more!
Currency Strength Meter

The Currency Strength Meter gives you a quick visual guide to identify the currencies that are currently strong or weak. They measure the main currencies strength in the Forex market (AUD, CAD, CHF, EUR, GBP, JPY, NZD, USD) by comparing all 28 pair crosses between them. This tool can be used to filter out your trades. It allows us to determine, for example, whether the US dollar is strengthening or weakening.
The strength of the currency is measured by the meter percentage. A higher percentage represents stronger currency while a lower percentage represents weaker currency. If the meter percentage for a currency is 90% or greater, then the color will change to green and if it 10% or below, then the color will change to red.
The best way to trade the Currency Strength Meter is to trade the pair with the strongest and weakest currency. If USD is strong and JPY is weak, then you can go long on USDJPY as an example.
You can also choose to quickly open a long or short trades based on your analysis. For example, if the US dollar is strengthening, then you can click the “B” button (Buy) next to it and it will open orders to go long USD. This means buy positions on USDJPY, USDCAD, USDCHF and sell positions on EURUSD, GBPUSD, AUDUSD and NZDUSD. The exact opposite will happen if you click the “S” button (Sell). The “C” button allows you to close any opened trades for that specific currency. It is customizable in that you can add a second row (up to 9 instruments) to the currency strength meter section.
Trade Manager
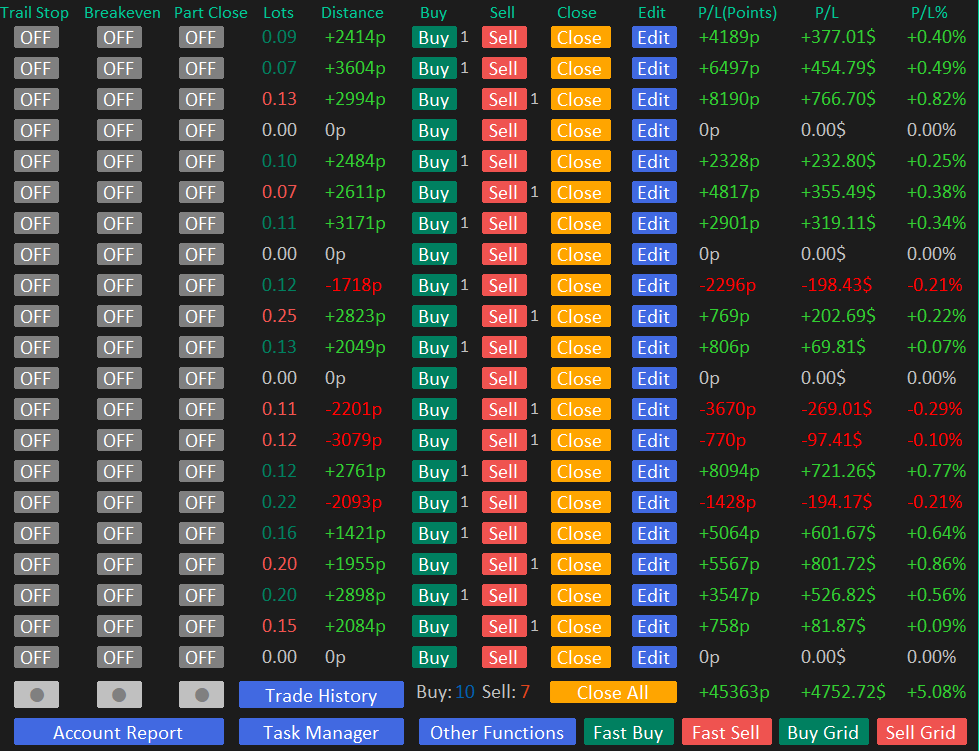
The Trade Manager is used to manage your trades and it gives you the ability to open new trades, edit trades, and close trades manually.
The numbers besides the “Buy” and “Sell” buttons represents the total number of buy / sell trades you have currently opened for each symbol.
The Buy & Sell buttons will open the Order Management dashboard which allows you to open market/pending orders manually. You can also click the Fast Buy and Fast Sell button to quickly open a market order with just one click.
The Close button will allow you to fully close or partially close the trade(s) for that specific pair.
The Edit button allows you to edit the TP/SL, hedge, and reverse an opened order.
The Distance column shows how far the current price is at hitting either your SL or TP. If the order is in negative, it will show how many points away you are at hitting your SL. If the order is in positive, it will show many points away you are at hitting your TP.
The profit is shown on the right side of the trade manager. It shows the total profit in points, in currency of your account, and percentage of your account size.
Order Management
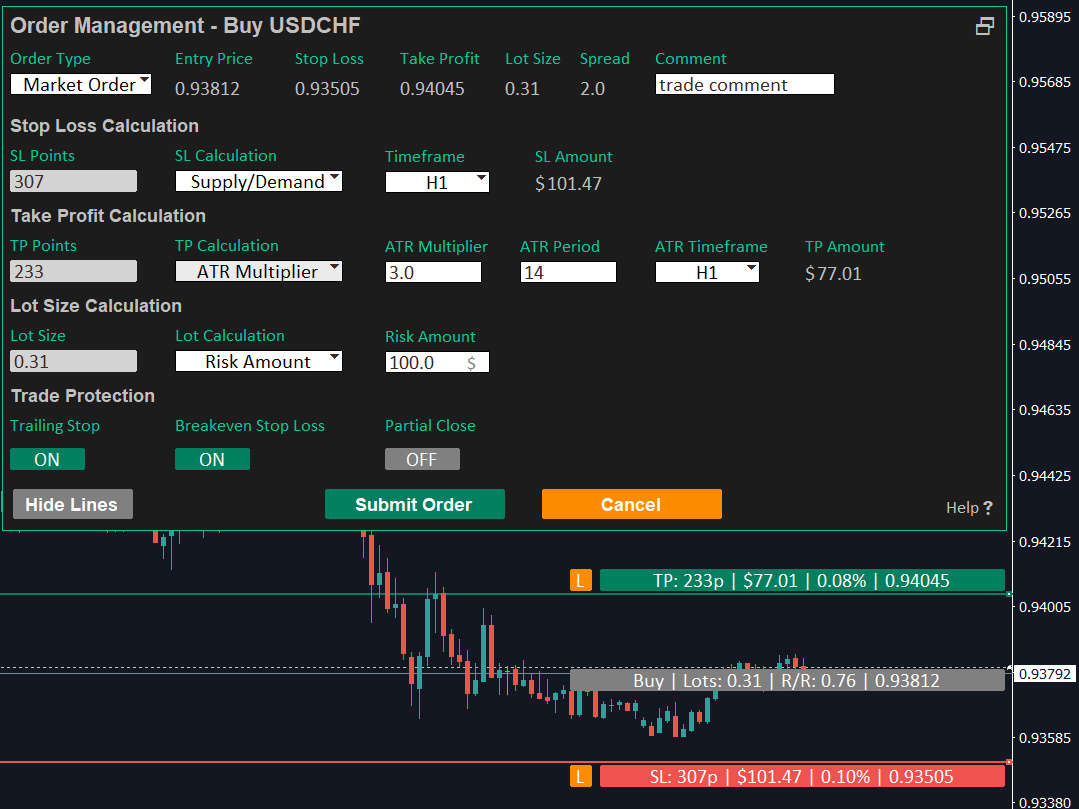
The Order Management dashboard allows you to easily create manual orders and calculate your stop loss, take profit, and lot size. To open this panel, click the “Buy” and “Sell” buttons on Trade Manager.
You can choose to enter by market order or pending order. If you choose pending order, you can edit the expiry date and also the entry price by dragging the order lines on the chart.
You can drag the order lines on the chart which will also automatically adjust the size of your SL and TP. It will also auto-adjust the lot size if you select risk per trade or risk amount as your lot size calculation.
If you want to reverse the position of your order from buy to sell or sell to buy, then you can quickly do so by dragging the TP order line below the entry line or drag the SL order line above the entry line. It will automatically switch the order type to buy or sell depending on where the TP and SL lines are located on the chart.
You can also enable/disable trade protection functionalities such as trailing stop, breakeven SL, and partial close directly on this dashboard.
Edit Orders Management

The Edit Orders Management allows you to edit the stop loss and take profit of your opened orders and pending orders. It also allows you to hedge and reverse your opened trade(s).
You can also set “Breakeven SL” which will move your stop loss to the same price as your entry price. This should only be used if the trade is in profit. Click the “Set” button and click “Edit” to move the SL to breakeven price.
Hedge button will open the “Hedge Position” panel and this allows you to specify the amount of volume you want to hedge on the selected order. The new hedge position will use the same TP and SL values from your selected order. Hedging is like an insurance on your trade by reducing your exposure and covering the amount of loss that would have otherwise been incurred if a trade is losing.
Reverse button will close the selected order and it will open an opposite position using the same size of SL, TP, and lot size. This feature is used if you have an opened trade and you think the market will reverse so you can take advantage of a price reversal.
Close Orders Management

The Close Orders Management allows you individually close orders for a specific pair. It will show you all opened trades and pending trades for a specific pair.
You can partially close trades by specifying the amount of volume you want to close. There are 3 Close Types you can choose from:
Percentage – calculates the percentage of the original lot size from a trade. E.g., If you set 100% to close, then it will close the entire trade. If you set 50% to close, it will close half of the current lot size.
Lot Size – manually specify the volume you want to close.
Amount – you can specify the total amount in the P/L value that needs to be closed. E.g., If a trade is currently in profit or loss for $125, then you can close $70 of that trade.
You can also delete pending orders for this pair if its no longer needed.
Close All Orders Management
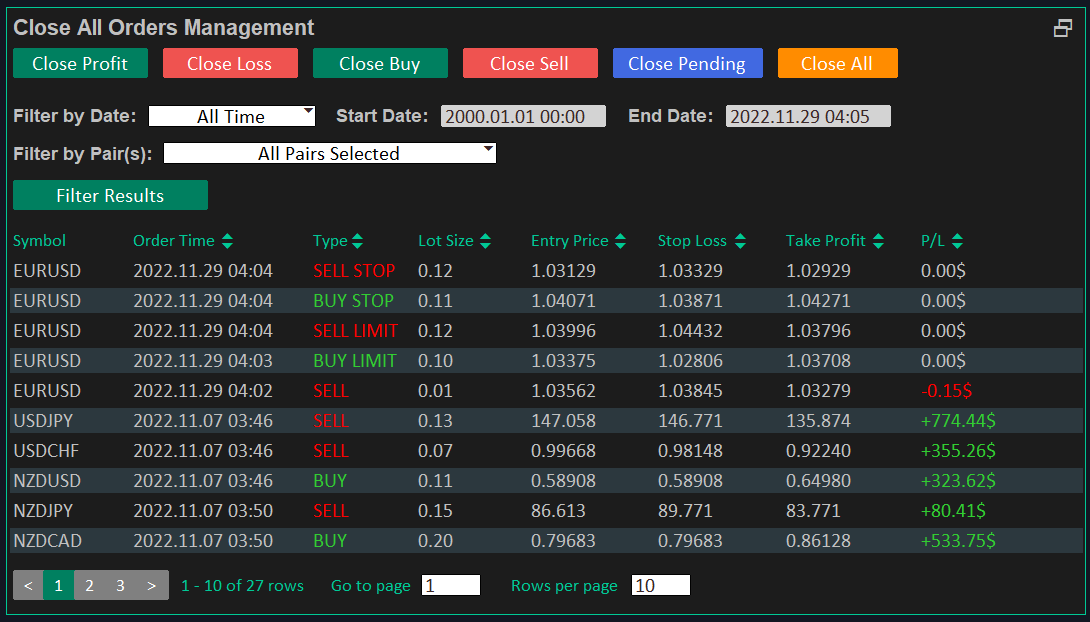
The Close All Orders Management shows all of your current opened orders and pending orders. It allows you to close orders based on your preference. You can close profit, close loss, close buy, close sell, close pending, and close all trades.
Close Profit will only close orders that is in profit.
Close Loss will only close orders that is in loss.
Close Buy will close any opened buy orders. This will not close any buy stop or buy limit orders.
Close Sell will close any opened sell orders. This will not close any sell stop or sell limit orders.
Close Pending will close all stop and limit orders.
Close All will close all opened trades and pending trades.
You can filter the list using the date filter and pairs filter. You can also sort columns by clicking the column name with up/down arrow. The Filter by Date field will filter the “Order Time” data.
Trailing Stop Management
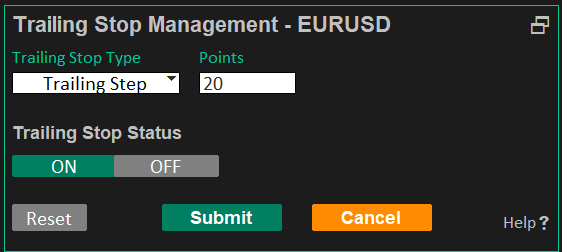
The Trailing Stop feature is used to minimize your risk by reducing the size of your stop loss as the price gets closer to your target profit. You can enable/disable this feature for every pair on the Trading Management dashboard.
Breakeven SL Management
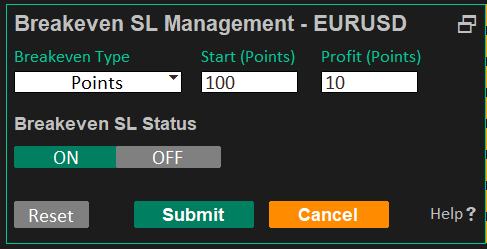
The Breakeven SL feature is used to move the stop loss to breakeven price once the price reaches a specific price target. You can enable/disable this feature for every pair on the Trading Management dashboard.
Partial Close Management
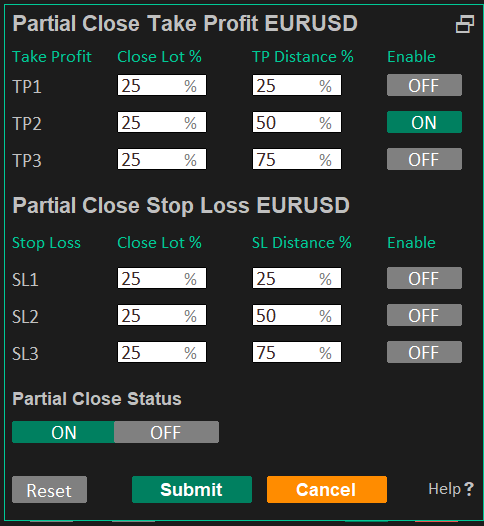
The Partial Close Management dashboard allows you partially close orders once they hit a specific distance from your target.
The Partial Close % column allows you to set how much you want to partially close when the price hits your distance %. Example: If you have 0.4 lot size order, and you set to close 25% partially, then it will close 0.1 lot size. If its 50% partial close, then it will close 0.2 lot size for the example given.
The Distance % is the total distance in percentage that the price has to reach in order to trigger a partial close. Example: You have an order with 40 pips take profit and you want to partial close when the price goes 20 pips in your favor. You then set the Distance % to 50% since 20 pips of 40 pips target is 50%.
You can partial close stop loss as well. The idea would be the same except you use this to minimize your losses if the trade is not going in your favor.
Task Manager
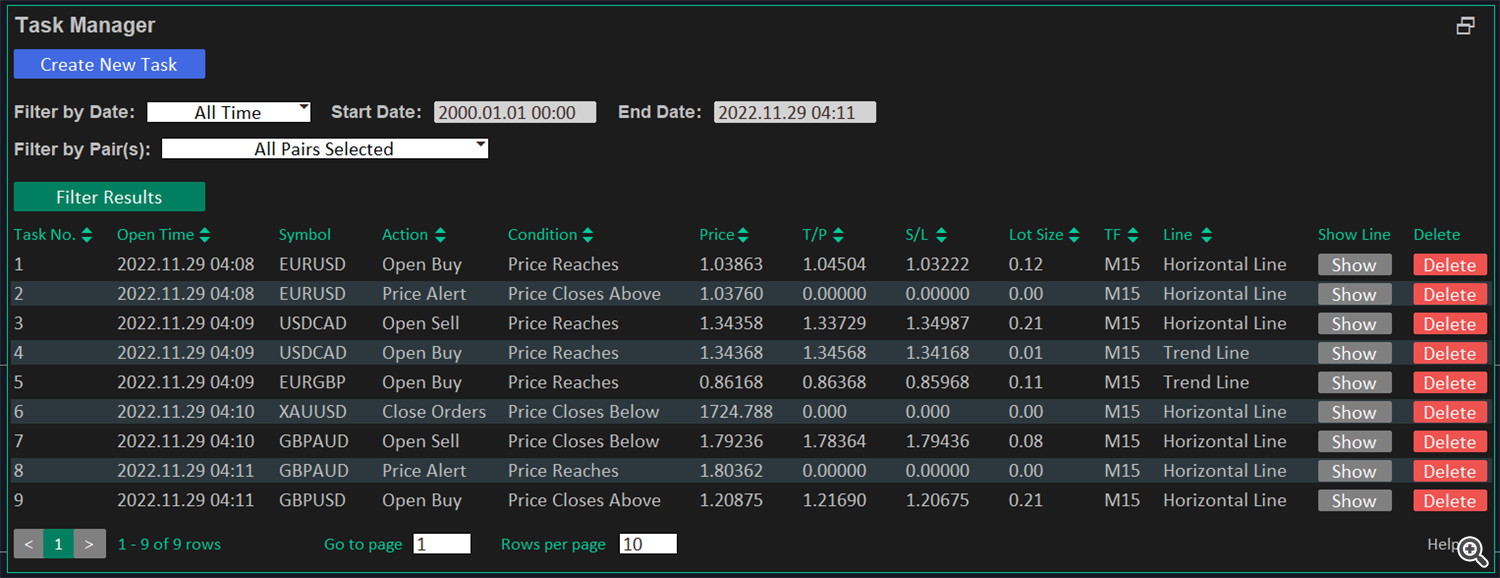
The Task Manager allows you to create a to-do task for automation such as opening buy/sell trades, price alerts, and closing of trades using both horizontal lines and trend lines to set your price target.
You can specify different conditions such as execute the task when price reaches a specific target, and/or price closes above / below a specified price target.
You can view all to-do tasks in a paginated list and it can be filtered using date and pairs. The Filter by Date field will filter the “Open Time” data. The data can be also be sorted in ascending or descending order based on the column selected to sort.
All pending tasks are listed and can be deleted if its no longer needed.
The “Show” button will show you the horizontal or trend line target for that specific task on your chart.
Tasks are not editable once submitted, so if you need to edit, you will need to delete the old task and recreate a new task.
Create New Task
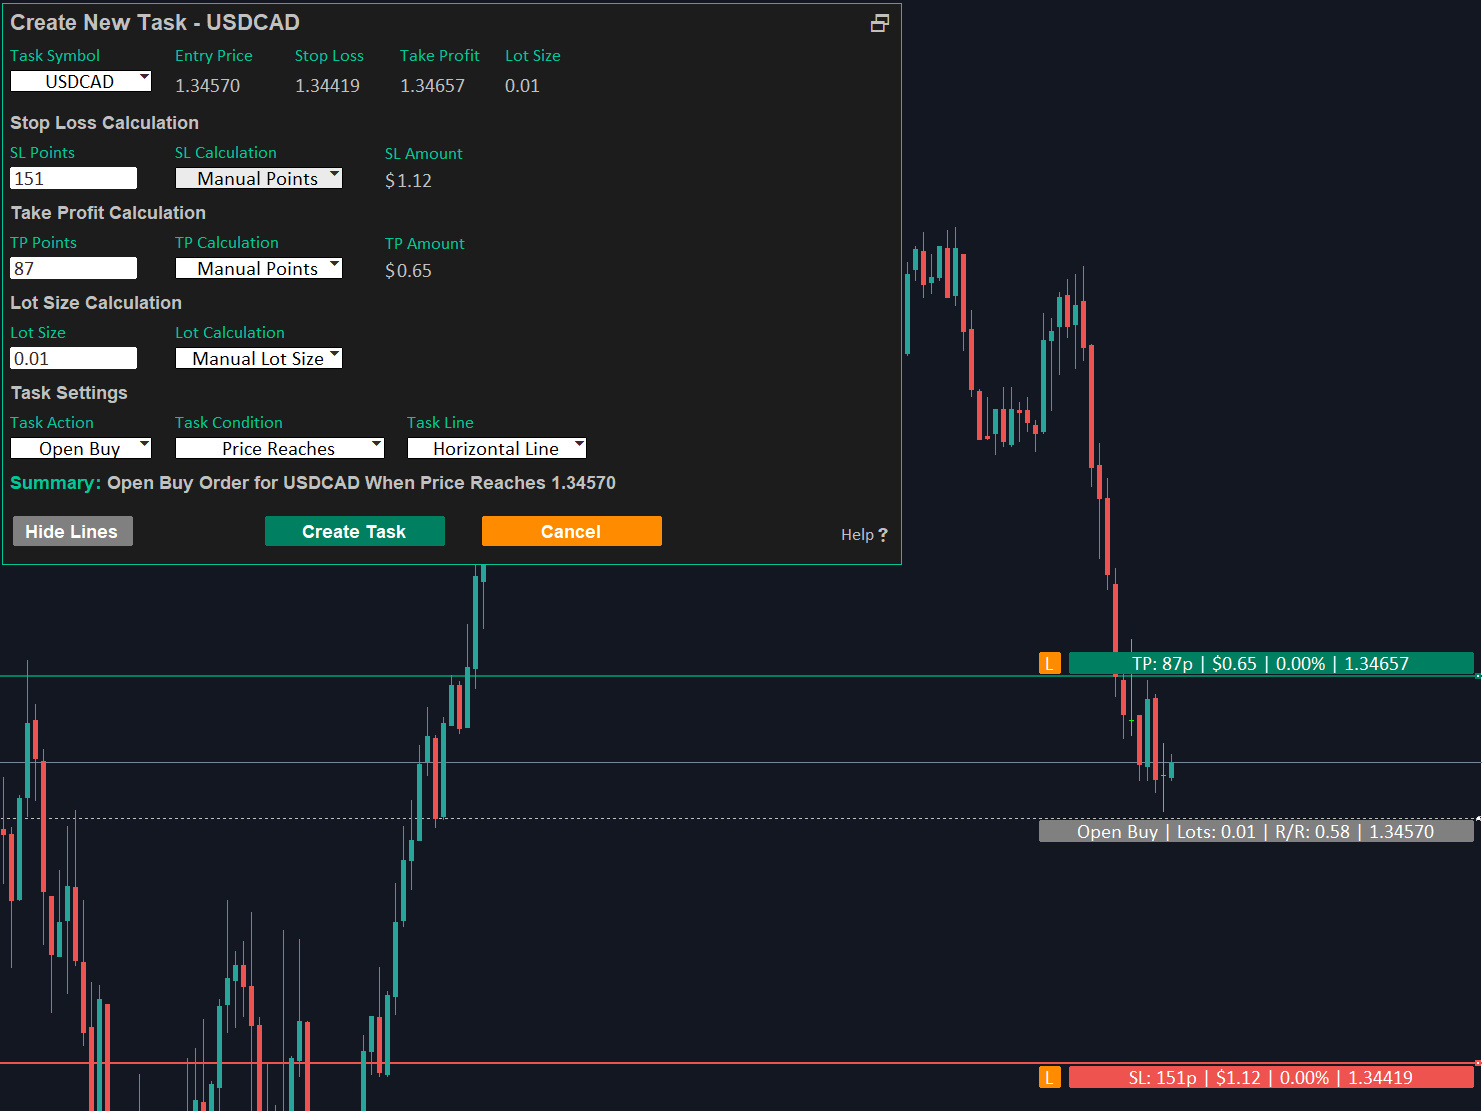
Create New Task is an extension of the task manager and this allows you to create a to-do task for automation such as opening buy/sell trades, price alerts, and closing of trades using both horizontal lines and trend lines to set your price target.
This dashboard uses similar layout and functionality as the Order Management dashboard. You will see order lines for both horizontal and trend lines, and both can be dragged and adjusted on the chart.
A “Summary” message will be provided to you so you know exactly the task you are creating.
Please note that the current timeframe on the chart will be recorded and it will be used for “Task Condition” when the option selected is “Price Closes Above” or “Price Closes Below”. If you need to change timeframe on the chart, then you can just switch timeframes while the “Create New Task” panel is still opened.
Account Summary Report
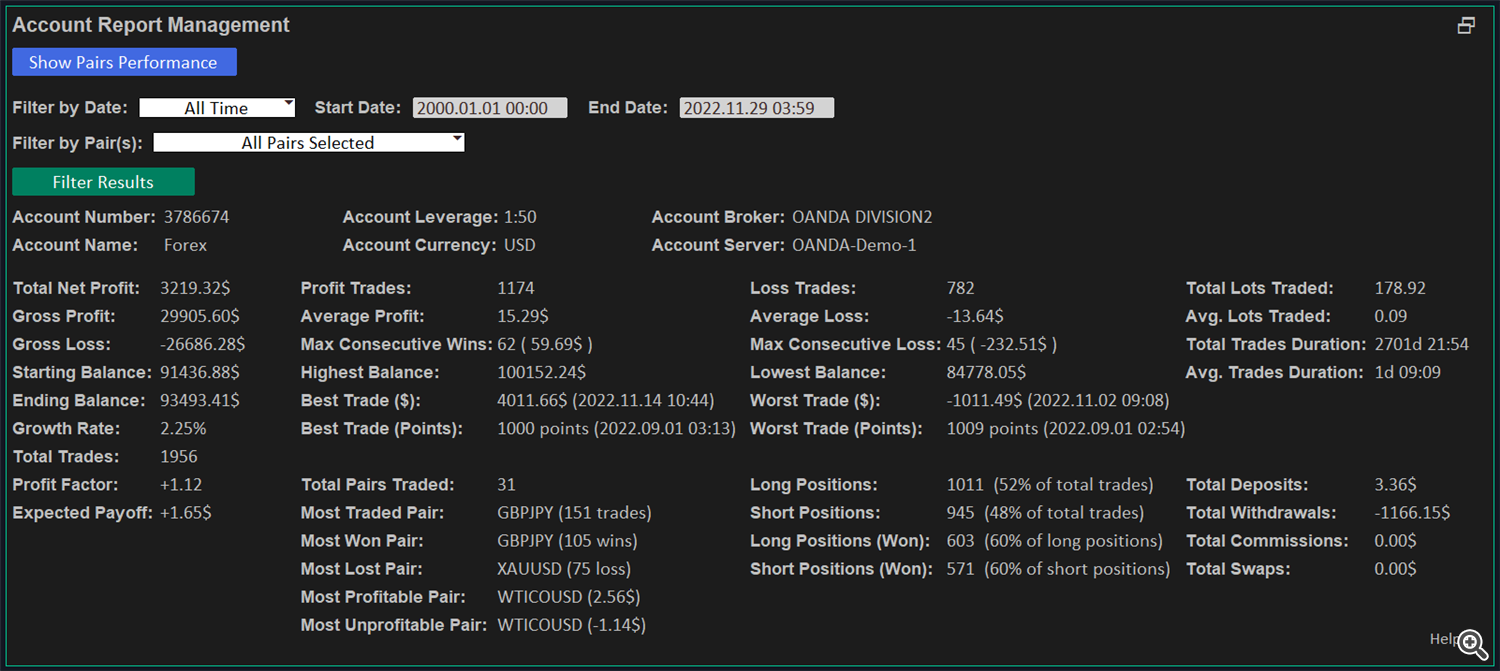
Account Summary Report shows detailed statistics and performance of your trading account.
You can also use the filter by date and filter by pairs feature to customize the report based on the selected filter. The Filter by Date field will filter the date the order was opened. E.g., You can show statistics of your account for the trades you made last month. You can do so by selecting the “Last Month” option on the Filter by Date field. You can also individually generate report for each pair or even grouped pairs since you can select multiple pairs at once.
Pairs Performance Report
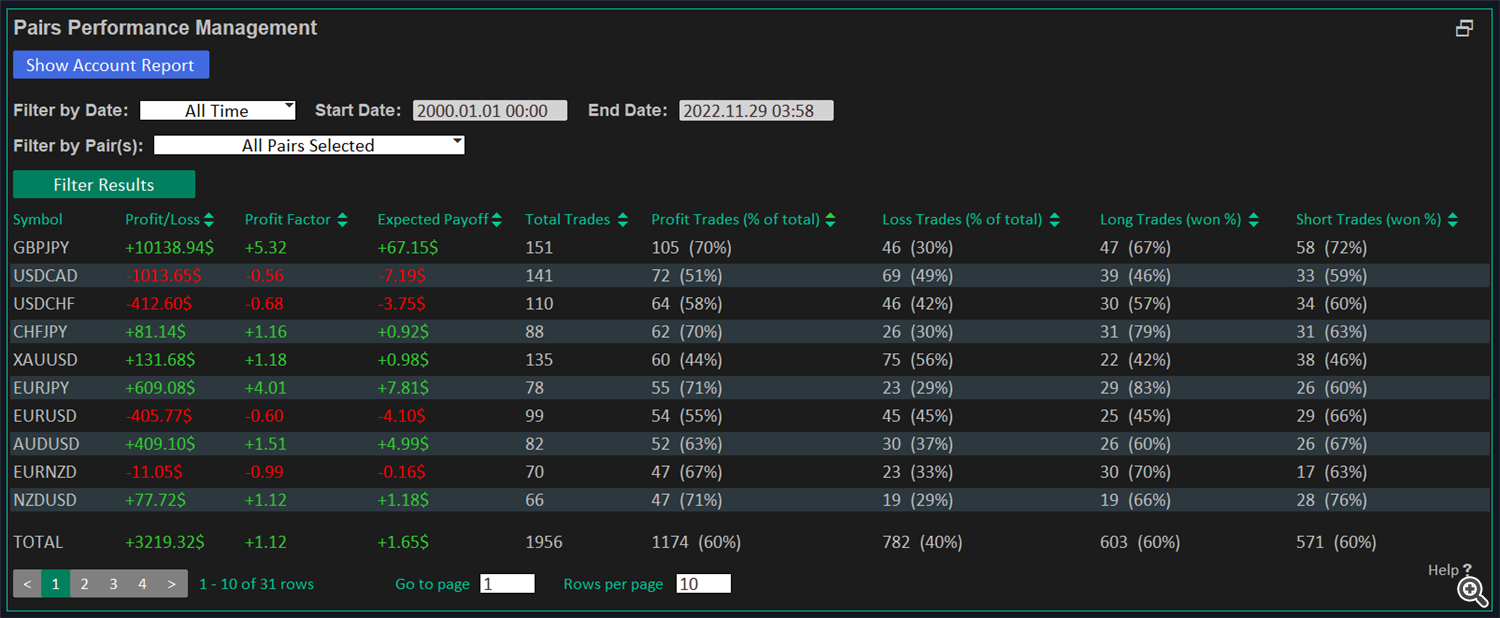
The Pairs Performance Report allows you to check and analyze the performance of each pair on your account. You can easily see at a glance whether the pair you have been trading has been profitable or not. You can open this panel by clicking the “Account Report” button on the main dashboard.
- Profit/Loss – this column shows the financial result of each pair.
- Profit Factor – Ratio of the gross profit to the gross loss.
- Expected Payoff – Shows the average return of each trade.
- Total Trades – total number of buy and sell trades.
- Profit Trades – the total profitable trades and their percentage in the total trades.
- Loss Trades – the total loosing trades and their percentage in the total trades.
- Long Trades – the number of long trades that resulted in profit and percentage of profitable long trades compared to the overall number of long trades.
- Short Trades – the number of short trades that resulted in profit and percentage of profitable short trades compared to the overall number of short trades.
You can filter the result by date and pairs. You can also sort the columns in ascending or descending order by clicking the column name that has the up/down arrow besides it. The Filter by Date field will filter the date the order was opened.
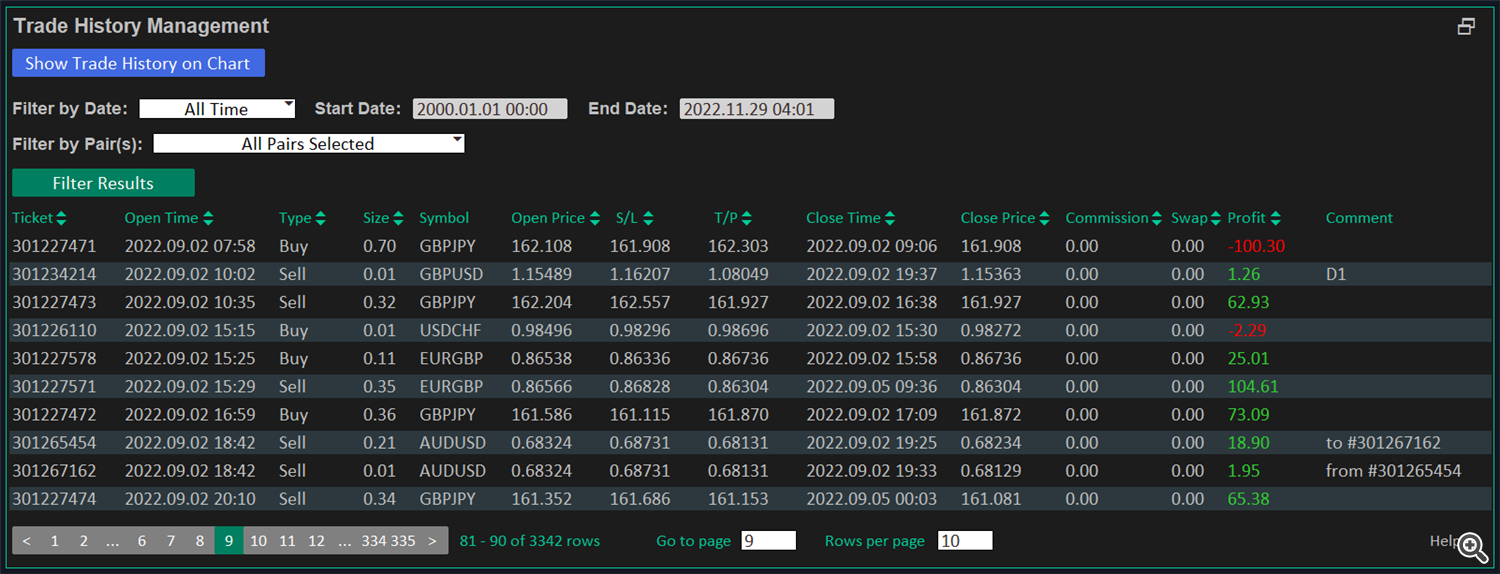
Trade History Report
Trade History Report shows you the trade history of your account. You can filter the result by date and pairs. The Filter by Date field will filter the “Open Time” data. You can also sort the columns in ascending or descending order by clicking the column name that has the up/down arrow besides it.
To show all trade history of your account, you will need to go to “Account History” tab on your MetaTrader terminal and right click on the window and select “All History”.
Trade History on Chart
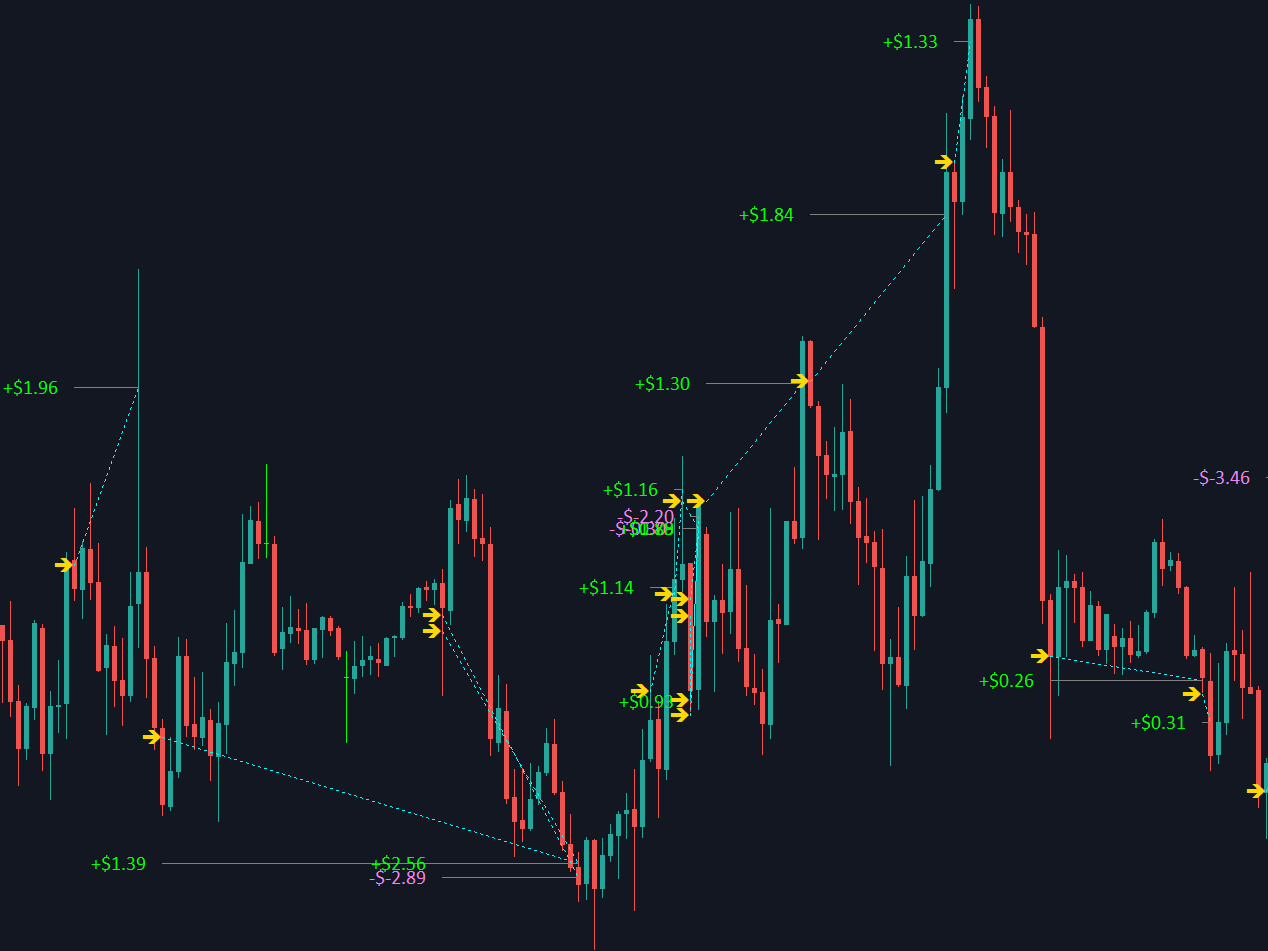
You can view your trade history directly to the chart by clicking the “Show Trade History on Chart” button on the Trade History Management dashboard. It will plot an arrow that represents your entry, the profit or loss for that trade, and a dotted line that extends to the price in which the trade was closed.
Order Chart Labels
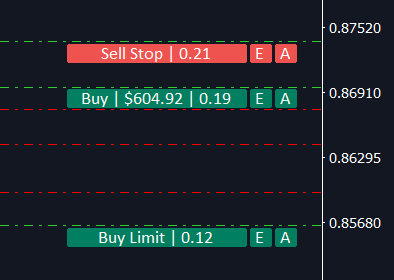
Order Chart Labels are labels shown directly on the chart to identify your opened trade. It shows you the direction of the trade, profit/loss, and the lot size.
The order labels will come with 2 buttons, the “E” and “A” button. The “E” button will show the Order Ticket Management dashboard which will allow you to edit, close, hedge, or reverse that order. The “A” button will show the order chart lines for SL, TP, and partial close lines (if enabled).
You can adjust the TP, SL and partial close values by dragging the order line after the “A” button is clicked.
Order Ticket Management

Order Ticket Management allows you to individually manage each order. You can open this dashboard by clicking the “E” button on the Order Chart Labels from the chart.
On this dashboard, you can edit the SL and TP, close the order, hedge order by opening an opposite trade, and reverse order by closing the current position and opening a new opposite position.
You can also set the SL to breakeven by clicking the “Set” button under “Set SL Breakeven” column and then click “Edit Order”.
The “Close Order” button will fully close the order.
The “Hedge Order” button will open the “Hedge Position” panel so you can choose the amount of volume to hedge. After submit, a new opposite position will be opened using the same stop loss and take profit prices of the selected order.
The “Reverse Order” button will close the selected order and it will automatically open a new opposite using the same size of stop loss, take profit, and lot size from the original order.
Hedge Position
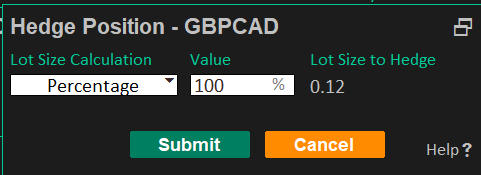
Hedge Position panel allows you to select the total amount of volume to hedge. You can hedge an order from the Edit Order Management dashboard or the Order Ticket Management dashboard.
You can choose from 2 options for lot size calculation:
Percentage – the total percentage of volume you want to hedge.
Lot Size – manually enter the lot size to be used as a hedge order.
It will show the total lot size that will be opened for the hedge order under the column “Lot Size to Hedge”.
Account Protection Management
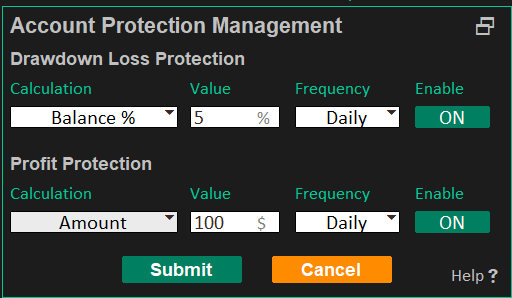
The Account Protection Management allows you to protect your account from further losses by setting the max limit of drawdown on your account and it also allows you to lock in your desired profit on your account. This is very helpful for risk management and also if you trade via prop firms.
Drawdown Loss Protection – this will protect you from high drawdown on your account.
Profit Protection – this will protect you from overtrading by locking in profits on your account. The “Balance %” sets a max limit of drawdown/profit percentage based on your account balance.
The “Amount” sets a max limit that you are willing to profit / lose in your account’s currency. E.g., If you set 500 points and the total profit / loss in points for all of your opened trades hits 500 points, then it will trigger to close all orders.
The “Points” sets a max limit that you are willing to profit / lose in points. E.g., If you set 500 points and the total profit / loss in points for all of your opened trades hits 500 points, then it will trigger to close all orders.
The “Frequency” column is used by both drawdown and profit protection to determine when to reset the protection. E.g., You can choose “Daily” to set your max limit drawdown / profit on a daily basis.
Manual Grid Management

Grid trading is a trading strategy that places a series of buy or sell orders at predefined intervals at a fixed price. You can open either a buy or sell grid orders manually by clicking the “Buy Grid” or “Sell Grid” button on the main dashboard.
Grid trading is considered to be a riskier strategy so it is important to calculate your risk before opening grid orders.
We have added a stop loss and a max number of grids to open to help you with your risk management.
You can modify the lot size per grid, the size of the grid, the total number of grid orders to open, take profit and stop loss.
Optional: you can enable Martingale on the input setting will add another layer of risk since it will increase your lot size per grid. Make sure you understand the risk and that you have enough free margin available before enabling this feature.
The grid order will first open a market order position followed by a series of pending orders. The program will then track and close the grid positions once it hits the take profit or stop loss value.
One Click Trading (Fast Buy / Fast Sell)

The Fast Buy and Fast Sell buttons allow you to quickly open a market order with just one click of a button. The Fast Buy button will open a buy market order and the Fast Sell button will open a sell market order on the current chart symbol. This is useful for scalpers and/or if you need fast execution of your trades.
Account Statistics

The Account Statistics sections shows your current account performance in real time such as daily, weekly and monthly profit, daily drawdown, win rate, and total risk of your current opened positions.
This gives you the ability to quickly glance over and track the current performance of your account so you can make adjustments based on your own personal goals.
The Win Rate column will show the win rate of your last 100 trades.
The Drawdown column shows the daily drawdown of your account.
Todays P/L, Weekly P/L, and Monthly P/L shows your net profit/loss for those specific time period.
Open / Pending shows the total number of existing opened orders on your account and pending order shows the total buy limit, sell limit, buy stop, and sell stop orders on your account.
Stealth Mode
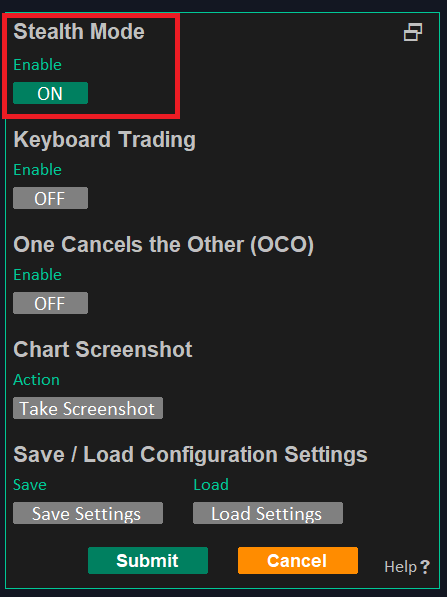
Stealth Mode allows you to hide the stop loss and take profit values from your broker to prevent stop loss hunting.
It will set the TP and SL values of your new and currently opened trades to zero. The values for SL and TP will then be stored locally on the trading system, so it is important to keep the system running in order to track these values.
The trading system will automatically check the hidden values and close the trade once the price reaches the SL and TP.
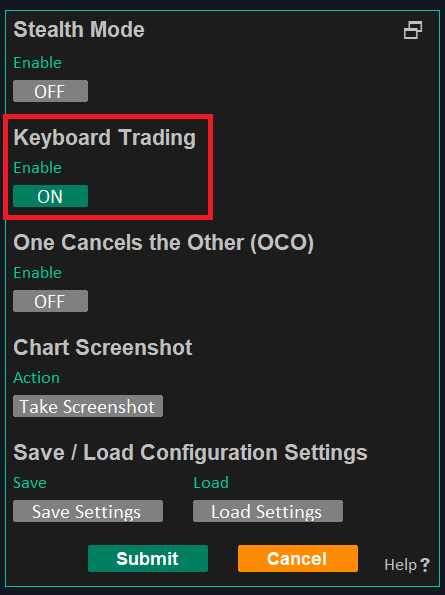
Keyboard Trading
Keyboard Trading feature allows you to perform trade functions using keyboard shortcuts. Once this is enabled, you can just press the specified keyboard shortcut interact with the dashboard. Also, make sure that the chart is in focus on MT4 by clicking anywhere on the chart before you perform the keyboard shortcuts.
If enabled, you can close panels using the “Tab” key and submit forms on selected panels such as Trailing Stop Management, Breakeven SL Management, Partial Close Management, and Order Management using “Shift” key.
You can map your own custom keyboard shortcuts on the input settings of the EA.
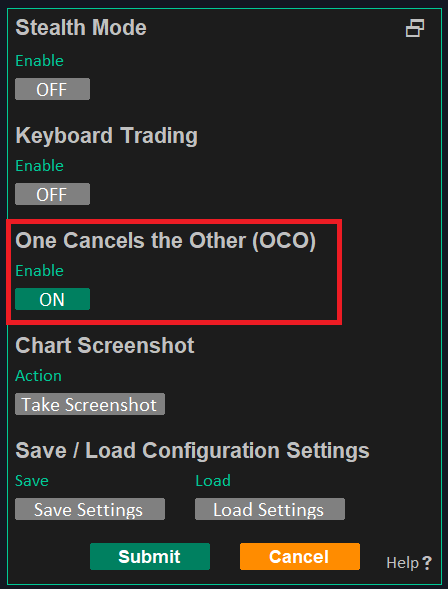
One Cancels the Other (OCO)
One Cancels the Other (OCO) allows you to manually create multiple pending orders for each pair and once one of the pending orders is executed, then it will automatically cancel the other pending orders from the same pair.
Switch Column Data (ADR & Spreads)
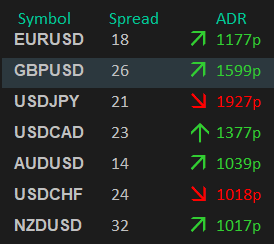
You can now switch the “Price” column and the “Change%” column on the main dashboard to “Spread” and “ADR” respectively. You can easily switch back and forth by clicking the column name of “Price” and “Change%” on the main trading dashboard.
You can download the attached FAQ, Input Settings, and User Manual PDF for more detailed explanation.
You can test this TradePad Pro on the strategy tester or you can request a free trial to test on live charts by private message.
Purchase, rent, or download strategy tester demo here: https://www.mql5.com/en/market/product/88698



![[$9,496] in 5 Days Using 'Supply Demand EA ProBot' (Live Results) [$9,496] in 5 Days Using 'Supply Demand EA ProBot' (Live Results)](https://c.mql5.com/6/965/splash-preview-761070-1740062258.png)