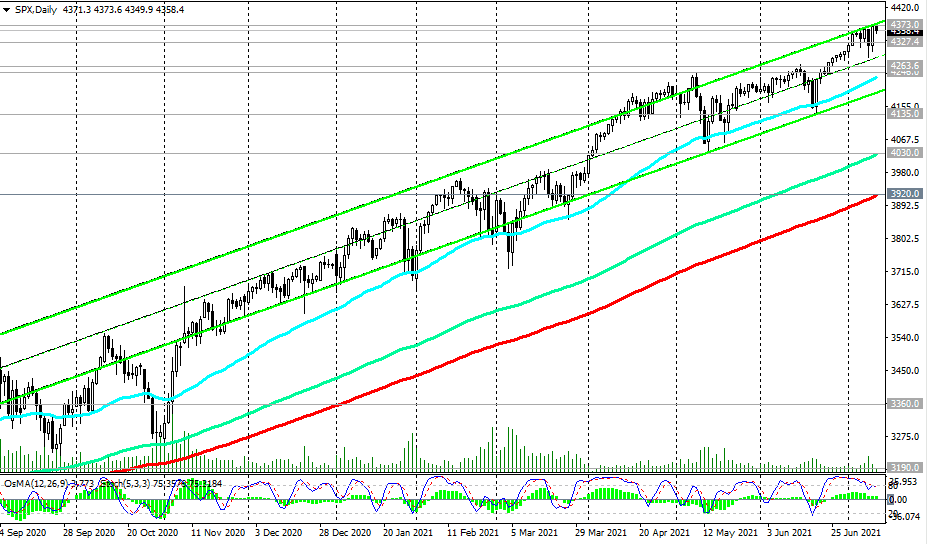
S&P 500 continues to trade within the upward channel on the daily chart, in the zone above the key support levels 3920.0 (ЕМА200 on the daily chart), 3190.0 (ЕМА200 on the weekly chart). In the area above the important short-term support level 4327.0, long positions in the S&P 500 are not in danger. A breakthrough of this support level may become a signal for a deeper correction to support levels 4263.0 (ЕМА200 on the 4-hour chart), 4246.0 (May highs).
In the current situation, however, long positions remain preferable, and the breakdown of the local resistance level of 4373.0 will become a signal to build up long positions (see also "Fundamental Analysis and Recommendations")
Sell Stop 4344.0. Stop-Loss 4366.0. Targets 4327.0, 4263.0, 4246.0, 4135.0, 4030.0, 3920.0
Buy Stop 4366.0. Stop-Loss 4344.0. Targets 4373.0, 4400.0, 4500.0
*) S&P 500: Current Fundamental Analysis and Market Expectations
**) the most up-to-date "hot" analytics and trading recommendations (including entries into trades "by-the-market") - https://t.me/fxrealtrading
***) trade! invite partners! earn!


