Today we found a special situation on the USDJPY chart
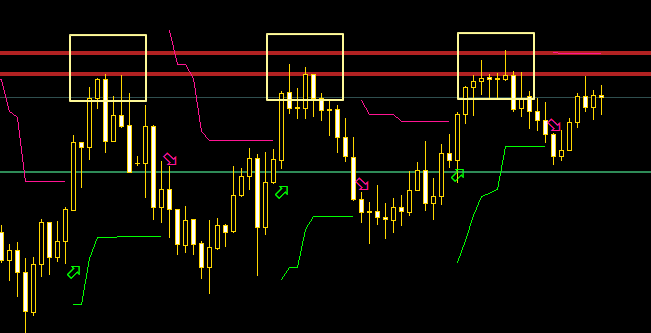
USDJPY is attacking this resistance zone three times during the NY session of the last three days.

Today this move starts during the London session which increases the probability of a breakout.
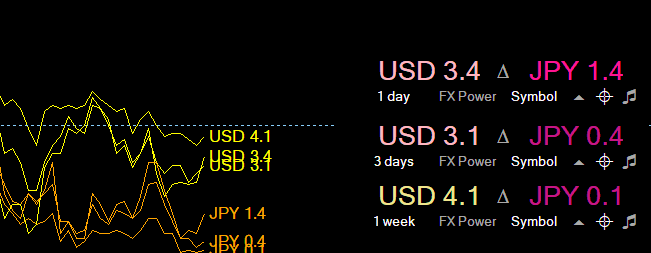
So, is this move confirmed by the individual strength of the underlying currencies?

The JPY is now close to the bottom and the USD is gaining strength.
Nonetheless the USD is still on
the weak side of the FX Power scale.
Check this YouTube tutorial to see how we create this special FX Power instance
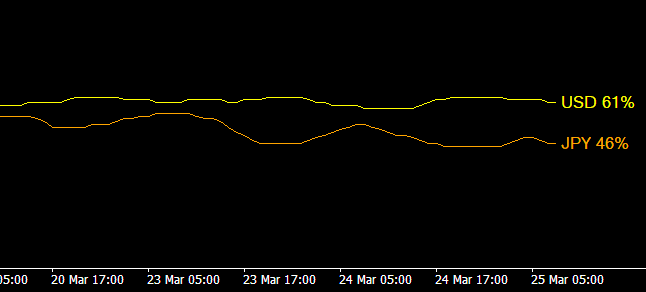
And what's the situation considering the real trading volume?

The JPY is clearly going down but the USD stagnates which is the reason why this pair was unable to break this
resistance cluster yet.
A rising USD long ratio would clearly help to push USDJPY easily through this resistance. So watch out what
happens in the USD volume.
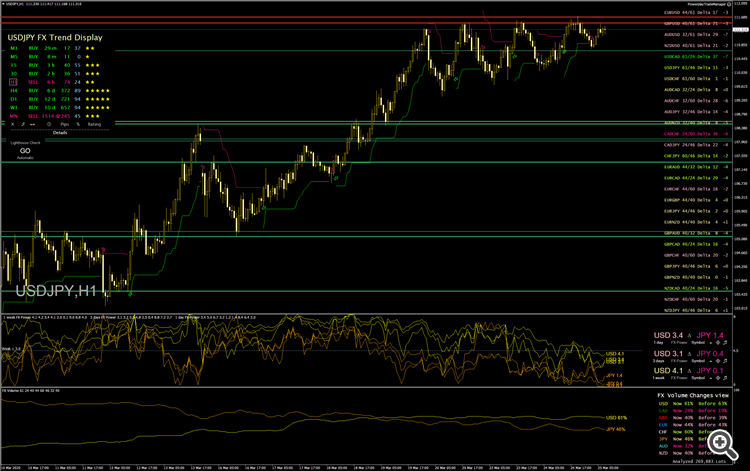
This is how this USDJPY chart looks completely
When this breakout on happens it will push all JPY pairs upwards.
Find the right trading opportunities
day by day!
(and learn when
to better stay out as well)
1. Visit https://www.mql5.com/en/blogs/post/677671
2. Have a look at our free News Channel
-> https://t.me/STEIN_INVESTMENTS_NEWS
Study
the published articles in detail to learn how to spot great trading opportunities.
Besides the advantage of professional
in-depth market analysis provided by my tools,
you'll get access to an exclusive group of
skilled and successful traders who are willing
to share their experience and trades
with anyone interested.
It takes just two steps to become part of our great and
successful community
1. Get your toolset at https://www.mql5.com/en/users/blueball/seller
2.
Send proof of your purchase to https://t.me/SteinInvestments
and
you'll get your invitation to our amazing group chat
All the best and happy
trading
Daniel


