
EURUSD THIS IS WHY IT WENT DOWN 200 PIPS -TRADING WITH WEIS WAVE WITH SPEED INDEX
17 March 2020, 22:09

0
124
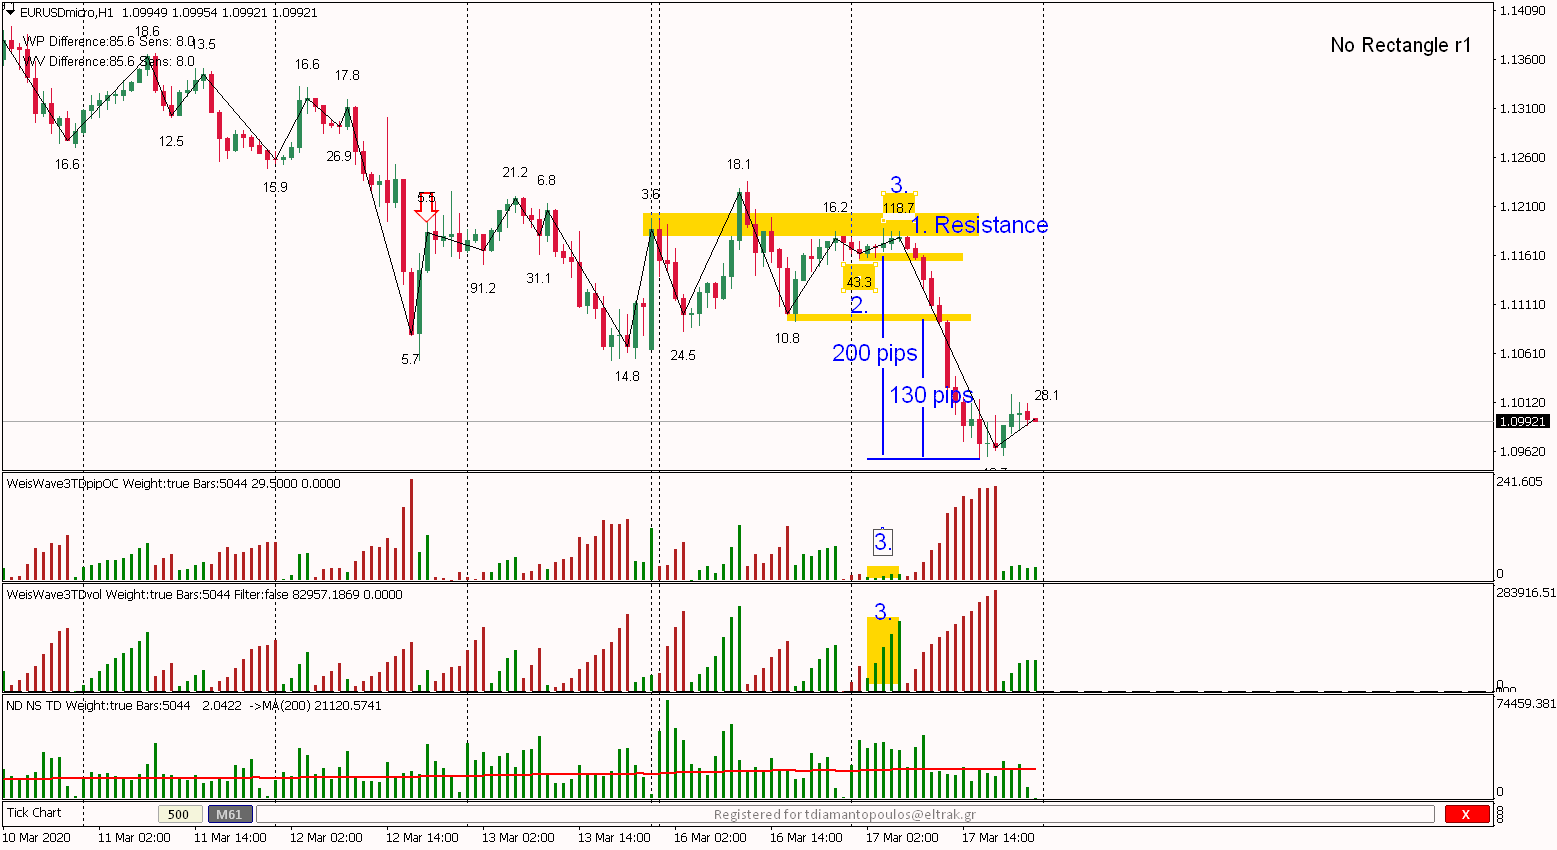
Setup 1Hour Chart
Indicators: Weis Pip Wave, Weis Wave with Alert (+Speed Index) and No Demand No Supply ( https://www.mql5.com/en/users/takisd/seller)
Our Story:
1. Reach Resistance Level
2. First Push Down - volume with small Pip move and High SI of 43.3
3. Hard to move up - Huge volume with insifficant pip move - Extremely High SI of 118.7 (Nothing like that on the entrire chart)
And Down we go...
It does not get any easier than that. Enjoy!


![[$9,496] in 5 Days Using 'Supply Demand EA ProBot' (Live Results)](https://c.mql5.com/6/965/splash-preview-761070-1740062258.png "[$9,496] in 5 Days Using 'Supply Demand EA ProBot' (Live Results)")

