EURGBP - Nice Break - TRADING WITH WEIS WAVE WITH SPEED INDEX
2 December 2019, 16:33

0
103
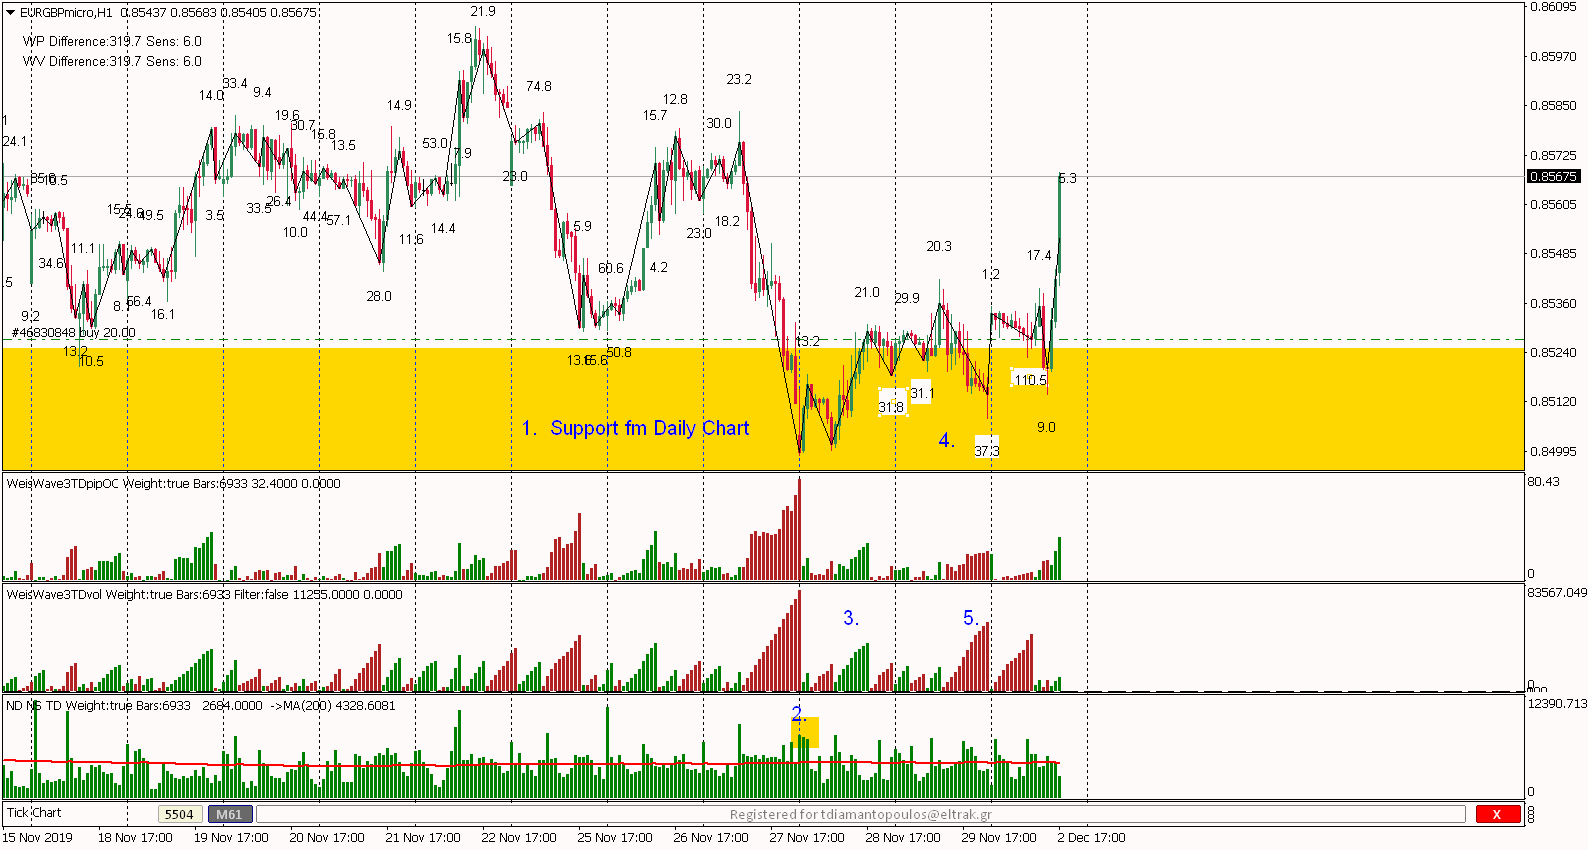
Setup Hour Chart chart
Indicators: Weis Pip Wave, Weis Wave with Alert (+Speed Index) and No Demand No Supply ( https://www.mql5.com/en/users/takisd/seller)
Nice Break - Easily identified - if you read your waves with Speed Index.
1. Support coming from Daily Chart
2. High volumes at the bottom during early morning hrs (3 days back)
3. First significant up volume wave after two days.
4. Look at all the SIs at the down waves 31.8, 31.1, 37.3 and last one at 110.5 much higher than SIs from up waves.
5. Hard time to go down look at 37.3 and 110.5 SIs and Pip waves vs. Volume Waves
Finally closed the gap very fast this morning and UP we Go.
My order is visible on chart - 40 pips so far!!! Enjoy !!!