Is AUDCAD Ready to go UP? - TRADING WITH WEIS WAVE WITH SPEED INDEX
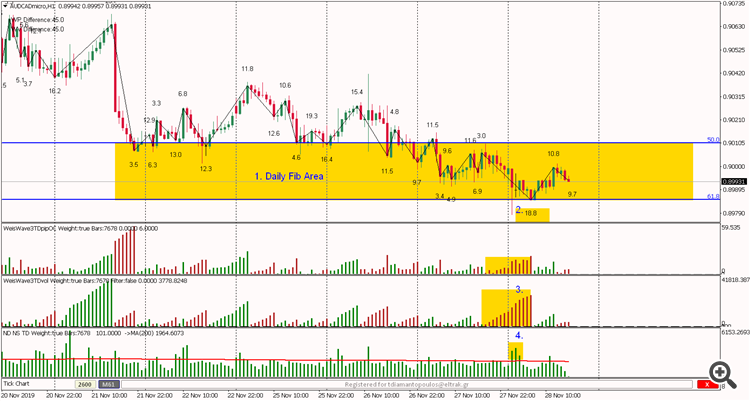
Setup Hour Chart chart
Indicators: Weis Pip Wave, Weis Wave with Alert (+Speed Index) and No Demand No Supply ( https://www.mql5.com/en/users/takisd/seller)
Is AUDCAD Ready to go up - tommorow we have High Impact News for CAD. By reading the chart what do you thing is going to happen?
Short or Long ? Looking forward for your Forecast, please comment.
1. We are at Daily Fib Levels.
2. High Speed Index of 18.8 on the down wave - nothing like that on the down waves on the entire chart.
3. High Volume Down Wave- Small Pip Move
4. High Volume Bars at 61.8 levels
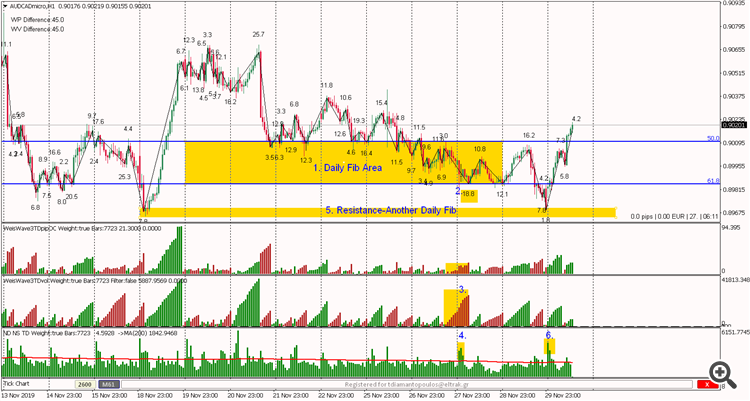
Update 2/12/2019 13:56 EET
That's what I am talking about, forecast correct. They just had to take out more stop losses (around 15pips lower from 18.8 SI).
5. It's a resistance point and alsa another Fib area
6. Huge volume on Monday Open


