
This is how Easy it is to Identify Trend change On a Tick Chart - TRADING WITH WEIS WAVE WITH SPEED INDEX
5 November 2019, 16:44

0
1 173
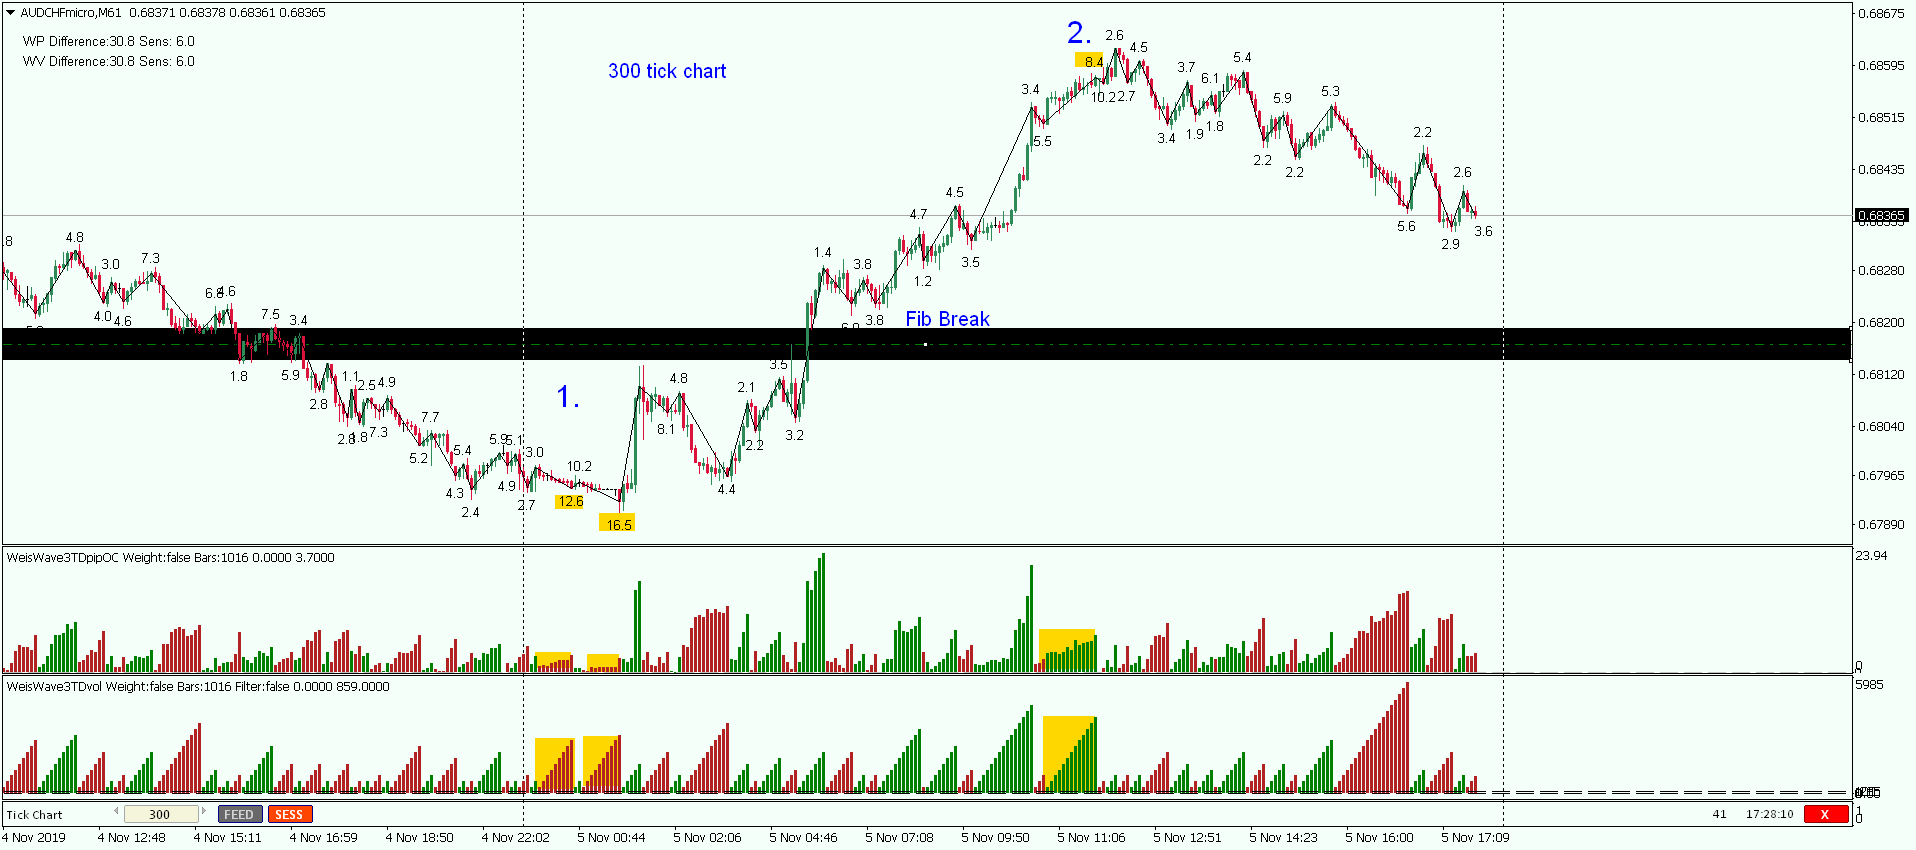
Setup 300 tick chart
Indicators: Weis Pip Wave, Weis Wave with Alert (+Speed Index)
This how Easy it to identify Trend Change on a Tick Chart ( constant volume chart):
Basically the following four criteria must be met:
a. We are at significant level (Support / Resistance, Fib, Pivot)
b. High Volume Wave - (Weis Wave with +Speed Index indicator)
c. High Speed Index - (Weis Wave with +Speed Index indicator) - Significant difference from previous waves
and
d. Low Pip Wave move - (Weis Pip Wave indicator)
Look at the example below point 1. (trend change upwards) and point 2. (trend change downwoards)- It does not get any Easier.


 & AMD Framework")
")