Is EURJPY Turning Bullish Or these High Range and Volume Candles are weakness? TRADING WITH WEIS WAVE WITH SPEED INDEX
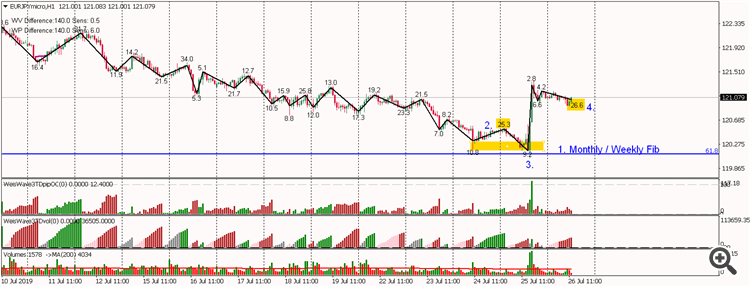
Let's read our waves with Speed Index:
We have been downtrending for a while.
1. We have reached Monthly / Weekly 61.8 Fib
2. First Push up with a High Speed Index of 25.3
3. False Brake on the Fib Area and then a huge move up - Is that strength or weakness ? The answer is "Don't know yet" .
4. High Speed Index of 26.6 on retracement after the big move. Is it a push down or continuation? The answer is "Don't know yet" but my bias is continuation because of the backround.
What to do next : be patient ,look at the 1min- 5min (where are the volumes coming at top or at bottom of the range). We might retrace to a new Fib or even to the monthly Fib to accumulate more orders.
to be continued...
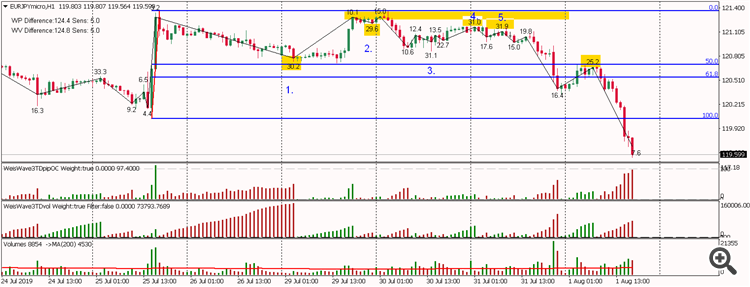
It was weakness after all, let's see how it became obvious after three days:
1. First Push Down - High Speed Index of 30.2 ( as mentioned before we do not know yet if this weakness or strength - so we have to wait and monitor the next waves)
2. Second Push Down when reached resistance - High Speed Index of 29.6
3. Some buying - High Speed Index 31.1
4. Hard Time to move up again - High Speed Index of 31
5. Another try to move up but High Speed index of 31.9
Therefore every time we are moving up most of the High Speed Index numbers are the top which means weakness and Down we go.


