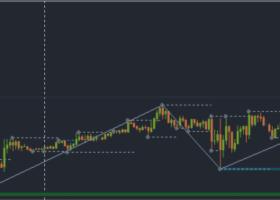
Since mid-April, the NZD / USD has been trading in a downward channel, falling from the level of 0.7380. In August, NZD / USD reached multi-month lows near the 0.6548 mark. The negative trend persists, and NZD / USD is traded in the descending channel on the daily chart.
In the event of a breakdown of the support level of 0.6548, NZD / USD will target at lows 2015 near the 0.6260 mark.
The objective of the upward correction after the breakdown of the resistance level 0.6715 (EMA200 on the 4-hour chart) may be the resistance level of 0.6865 (Fibonacci level of 23.6% of the upward correction to the global wave of the pair's decline from the level of 0.8800, which began in July 2014, level of 0.6260 and the upper limit of the range formed in July).
The prevailing negative dynamics. Short positions are preferred. The global downtrend, which began in July 2014, resumed.
Investors are preparing for the speech of Federal Reserve Chairman Jerome Powell at a symposium in Jackson Hole on Friday (14:00 GMT). Investors are interested in Powell's opinion about the growing US-China trade confrontation and the prospects for the monetary policy of the Fed.
*)An advanced fundamental analysis is available on the Tifia Forex Broker website at tifia.com/analytics
Support levels: 0.6600, 0.6548, 0.6500,
0.6410
Resistance levels: 0.6650, 0.6715, 0.6750, 0.6865, 0.6900, 0.6965

Trading Scenarios
Sell Stop 0.6620. Stop-Loss 0.6665. Take-Profit 0.6600, 0.6548, 0.6500, 0.6410
Buy Stop 0.6665. Stop-Loss 0.6620. Take-Profit 0.6715, 0.6750, 0.6865, 0.6900, 0.6965
*) For up-to-date and detailed analytics and news on the forex market visit Tifia Forex Broker website tifia.com


