Crude Oil Price Forecast: Oil Bulls Can Almost Taste 3-Month Highs
Talking Points:
- Crude Oil Technical Strategy: Massive Break of Technical Resistance On Watch In Monthly OR
- Traders Are Most Bullish Since January On OPEC Accord per CFTC
- US Dollar continues sideways, which takes out a component of downward price pressure
Oil Bulls continue to be rewarded by an OPEC Accord to curb production as the price of spot WTI trades at the highest levels since July. While the recent rise has been impressive following the post-Brexit announcement move down to $39.17, what is more impressive is the potential longer-term chart set-up for a Bull Run to the upside.
There is still cause for concern by some who think a USD Bull Market is in the making once the Fed decides to raise short-term interest rates or due to weakness elsewhere. Such a strengthening of the US Dollar could naturally put pressure on the price of Oil. However, if the USD fails to mature into an uptrend, we could be setting up for a favorable environment for further upside in the price of Crude Oil.
Another development in institutional positioning is the largest increase in long positions in WTI since January. This bullish positioning is an aggressive reversal from the bearish sentiment that had not been seen since September 2015 in recent CoT readings. The bullish sentiment comes in the forms of straight long positions via futures as well as options contracts that increased 8.1%. Such bullish exposure could see the market favor further upside on the charts.

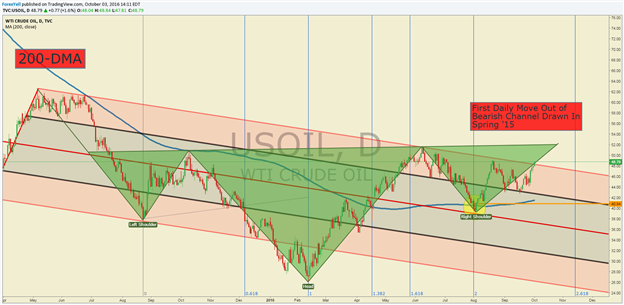
The chart above shows an emerging technical story for the Bulls. As explained in our quarterly guide on Oil,OPEC has met an agreement to cap supply at 750,000 barrels below current level. The chart above shows the headline for the long-watched Bullish Head & Shoulders pattern sitting near $52/bbl.
As of Monday, the price of Crude Oil broke briefly above the August highs of $48.96. As shown on the chart above, the price channel resistance line is now being broken and a daily close in the black would put Crude Oil above long-term resistance for the first time since the channel was drawn in mid-2015.
Given the long-term nature of the charting pattern in focus, the targets worth focusing on are in the mid-$60/lower-$70/bbl range. However, shorter-term swing traders may look for confirmation of a full-on Bullish break with a tag of the Weekly R2 Pivot of $50.96/bbl.
Lastly, you can also see the price resting above the 200-DMA, which favors a breakout happening higher as opposed to lower.
Key Levels Over the Next 48-hrs of Trading As of Monday, October 3, 2016


