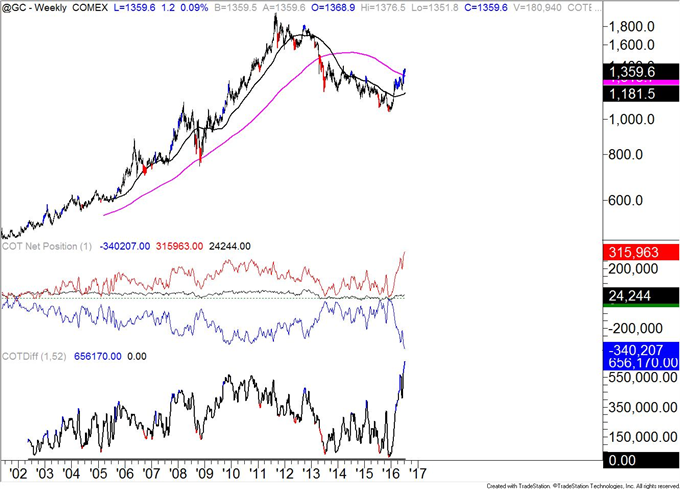
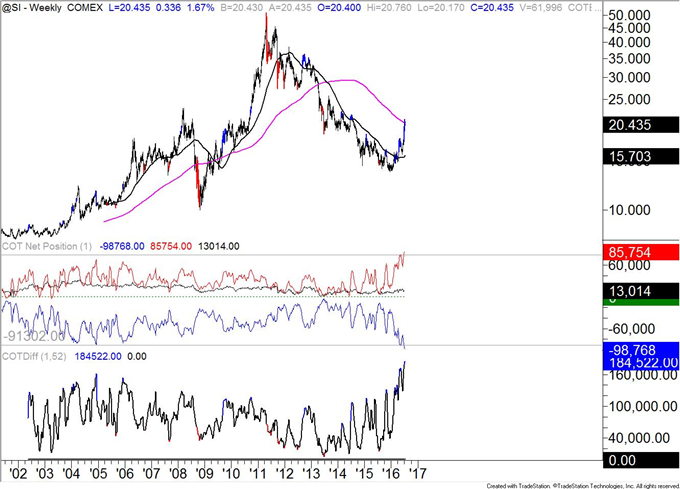
- Gold and silver positioning in unchartered waters
- Specs buy Mexican pesos
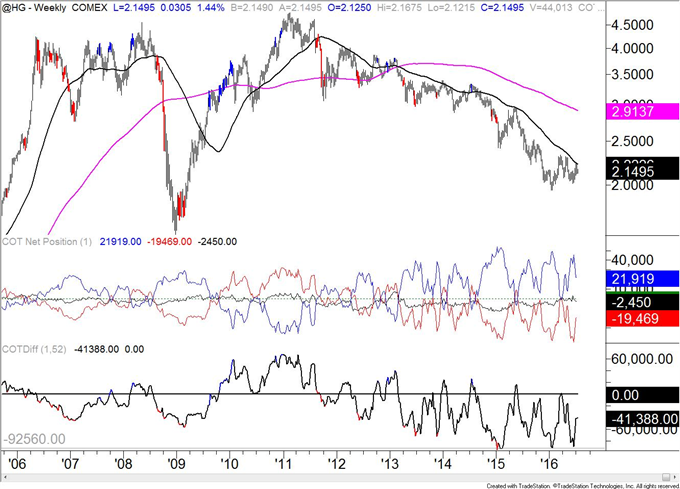
- Copper specs still getting squeezed
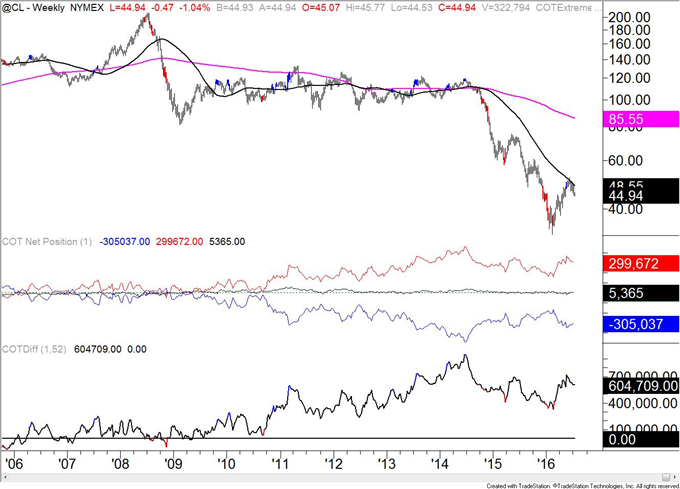
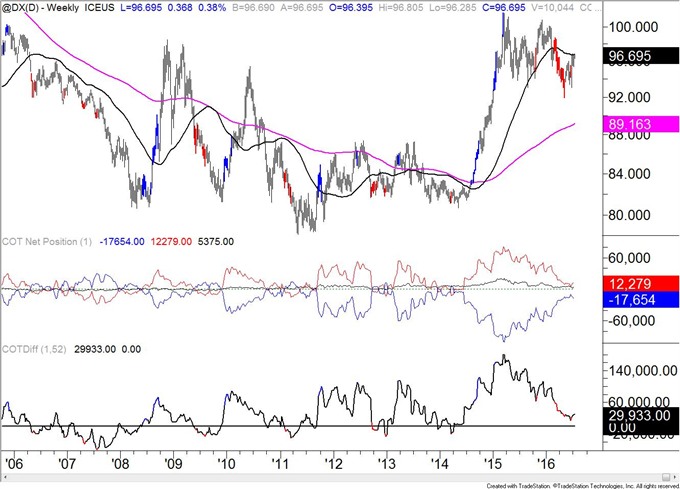
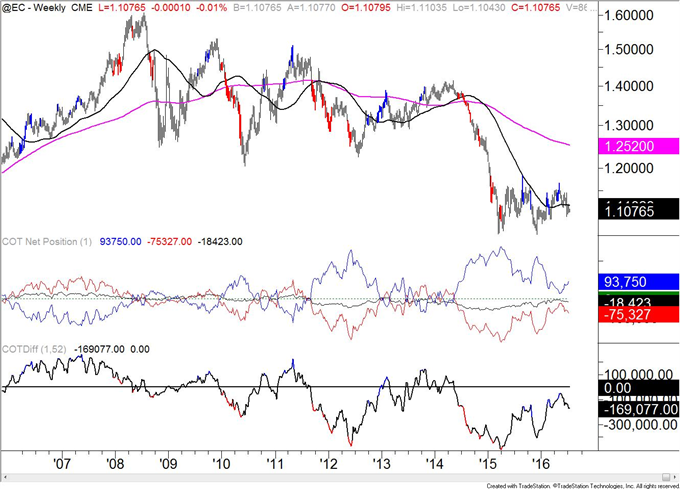
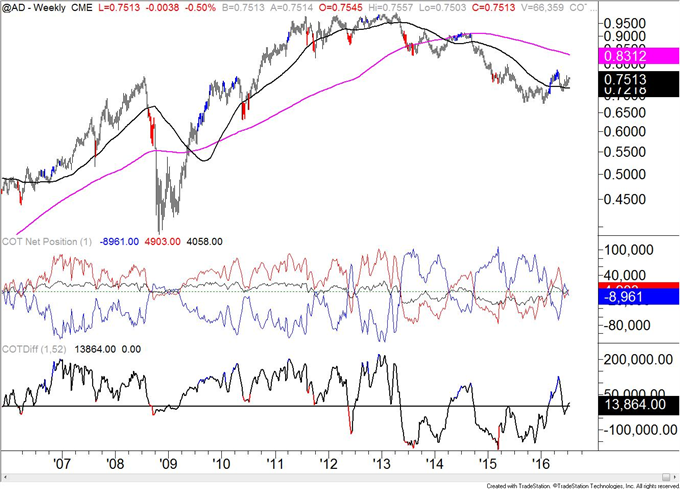
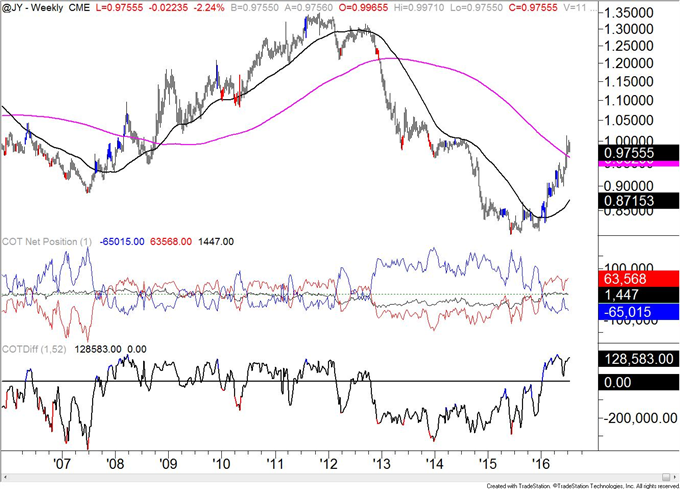
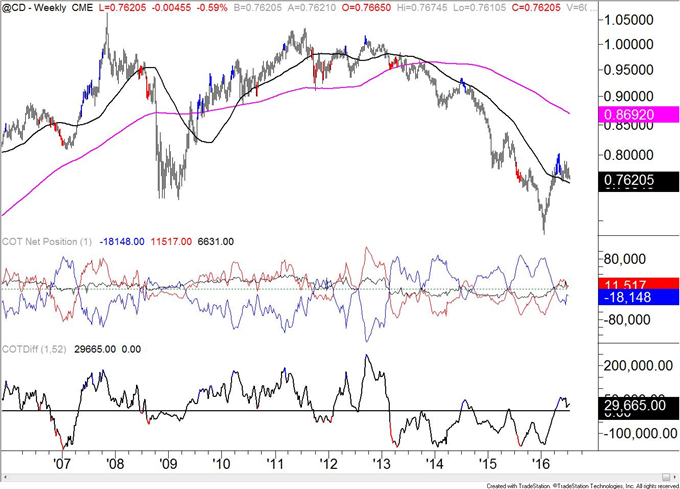
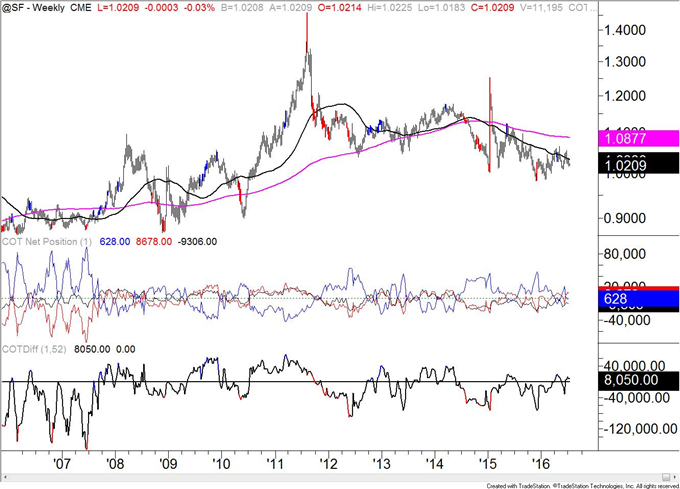
The COT Index is the difference between net speculative positioning and net commercial positioning measured. A blue colored bar indicates that the difference in positioning is the greatest it has been in 52 weeks (bullish) with speculators selling and commercials buying. A red colored bar indicates that the difference in positioning is the greatest it has been in 52 weeks (bearish) with speculators buying and commercials selling. Non-commercials tend to be on the wrong side at the turn and commercials the correct side.
Latest CFTC Release dated July 5th, 2016
Week (Data for Tuesdays) | 52 week Percentile |
20 | |
53 | |
18 | |
75 | |
90 | |
84 | |
90 | |
Mexican Peso | 67 |
Gold | 100 |
Silver | 100 |
Copper | 69 |
Crude | 77 |
Charts (all charts are continuous contract)
Non Commercials (speculators) – Red
Commercials – Blue
Small Speculators – Black
COTDiff (COT Index) – Black
US Dollar ICEUS Continuous Contract
Euro CME Continuous Contract
Australian DollarCME Continuous Contract
Japanese YenCME Continuous Contract
Canadian DollarCME Continuous Contract
Swiss Franc CME Continuous Contract
Mexican Peso CME Continuous Contract

Gold COMEX Continuous Contract
Silver COMEX Continuous Contract
Copper COMEX Continuous Contract
Crude Oil NYMEX Continuous Contract
