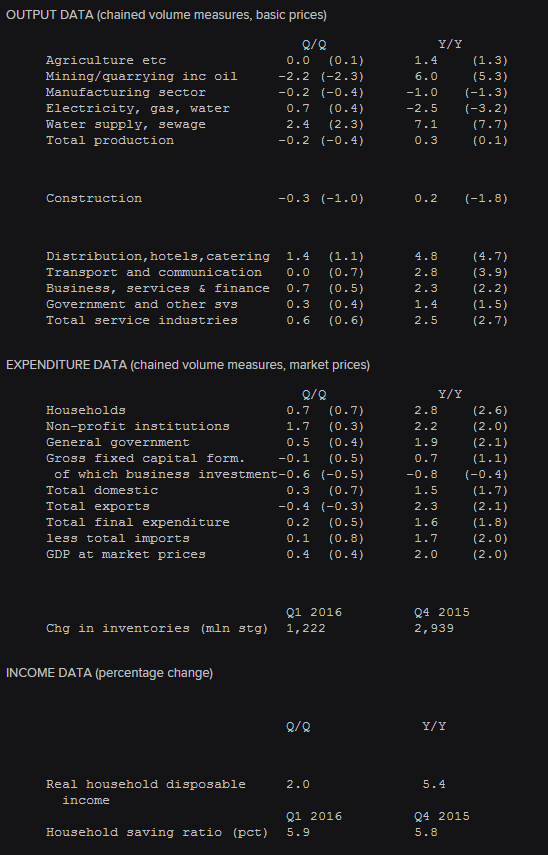
Details of the Q1 2016 UK GDP final revision data report 30 June 2016
- Prior 0.4%
- 2.0% vs 2.0% exp y/y. Prior 2.0%
- Business investment -0.6% vs -0.5% prior q/q
- -0.8% vs -0.4% prior y/y
Exports -0.4% vs -0.3% prior q/q
2.3% vs 2.1% prior y/y
Imports 0.1% vs 0.8% prior q/q
1.7% vs 2.0% prior y/y
Q1 current account balance -32.59bn vs -27.10bn exp. Prior -32.66bn. Revised to -33.96bn
April index of services 0.6% vs 0.2% exp m/m. Prior -0.1%. Revised to -0.3%
0.5% vs 0.4% exp 3m/3m. Prior 0.6%
Real household disposable income 2.0% vs -0.6% prior q/q
Household savings ratio 5.9% vs 3.8% prior q/q
Although
the headline number held up there's a mixed bag underneath. Some
components up, some down, some flat. If there was a bright spot it would
be the disposable income jump and the household savings ratio. Some of
that may have to be used to get through and Brexit slump.

Final Q1 2016 UK GDP details
Like yesterday's US GDP, the data is old news really so not a lot for the market to chew on. The pound hasn't really done anything. 1.3468 trades cable, 0.8254 EURGBP.

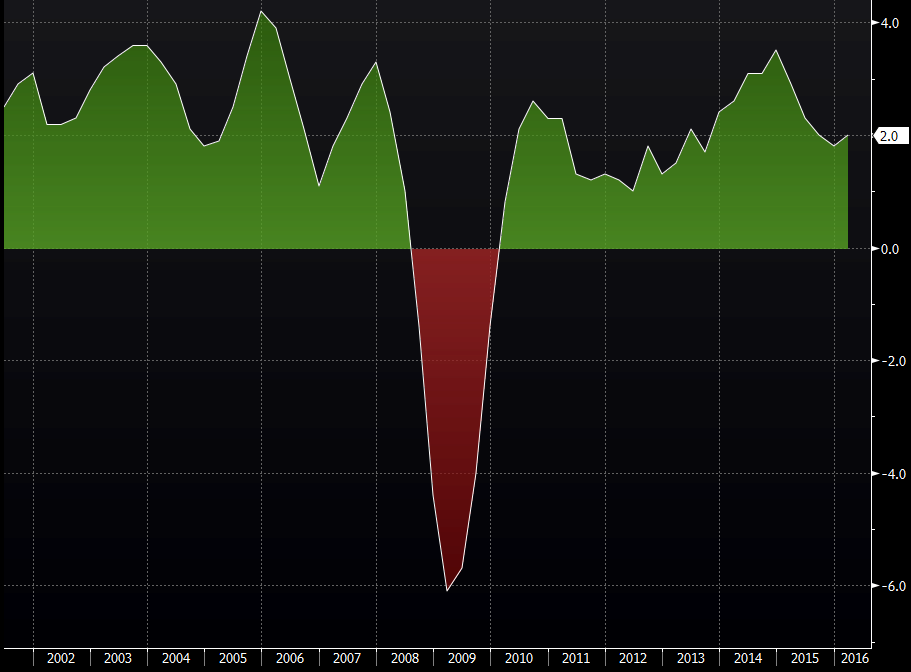
UK GDP y/y


