EUR/USD: Dollar Eases Modestly in Thin Trading
EUR/USD Current Price: 1.1138
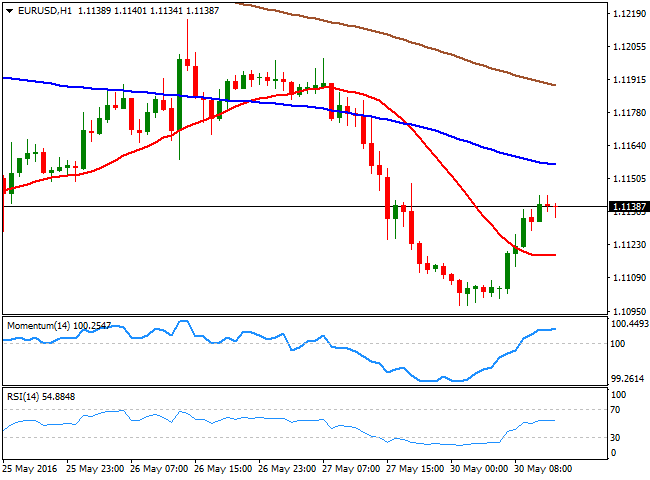
The American dollar gave back the ground gained at the beginning of the day, and the EUR/USD pair recovered from a fresh 2-month low of 1.1097, helped by positive data coming from Europe. The EU Consumer sentiment for May came in at -7, matching previous and expectations, although the economic sentiment indicator and the business climate beat expectations. Also, Germany released its preliminary May inflation figures, up by 0.3% monthly basis, while the YoY reading harmonized coming in at 0.0%, against a 0.1% decline expected. There are going to be no macroeconomic releases in the US.
Technically, the 1 hour chart shows that the pair trades near 1.1143, its daily high, with the upward potential fading, as the technical indicators turned horizontal within positive territory. In the same chart, the 100 SMA heads lower around 1.1160, providing an immediate resistance in the case of further advances. In the 4 hours chart, the technical picture favors the downside, as the price develops below its 20 SMA, whilst the technical indicators turned south below their mid-lines. Given that the US is on holidays, chances are of the pair holding within a limited range until the next Asian opening, with the base of the range around 1.1080, a daily ascendant trend line coming from November 2015.
Support levels: 1.1120 1.1080 1.1040
Resistance levels: 1.1160 1.1200 1.1245
GBP/USD Current price: 1.4615
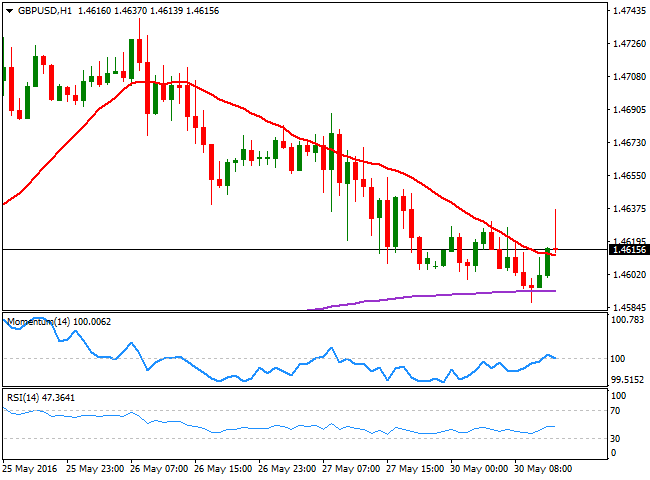
The GBP/USD pair fell briefly below the 1.4600 level, down to 1.4587, where the pair stalled intraday a couple of times during the past week. The recovery sent the pair up to 1.4637, so far the daily high, but is now down to trade pretty much flat daily basis, as London is down on a local holiday. The overall technical stance is still bearish, although in the short term, the 1 hour chart presents now a neutral stance, as the price is hovering around a bearish 20 SMA, whilst the technical indicators head nowhere around their mid-lines. In the 4 hours chart, the 20 SMA is turning lower well above the current level, whilst the technical indicators have turned modestly higher within negative territory, not enough to confirm additional gains for today.
Support levels: 1.4586 1.4550 1.4520
Resistance levels: 1.4655 1.4690 1.4730
USD/JPY Current price: 111.14
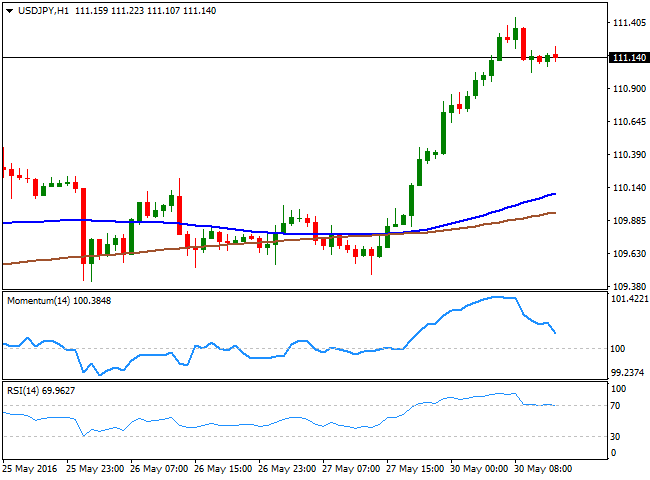
Pressuring the 100 DMA. The USD/JPY pair advanced to its highest in 5 weeks, reaching 111.44, with no clear catalyst behind the move, but market's speculation on a sale tax delay, after Japan Retail Sales came out slightly better-than-expected but still in negative at -0.8%. The pair is now retreating from its 100 DMA, but holds above the 111.00 figure, maintaining the positive tone in the short term, as in the 1 hour chart, the price is far above its moving averages, whilst the RSI is currently consolidating around 70. The Momentum indicator in the mentioned time frame has retreated and keeps heading lower, but remains well above 100 and given that the price has pulled back only partially, chances of a downward move seem limited. In the 4 hours chart, the technical indicators have retreated partially from near overbought readings before resuming their advances, whilst the 100 SMA crossed above the 200 SMA well below the current level, maintaining the risk towards the upside.
Support levels: 111.00 110.60 110.20
Resistance levels: 111.45 111.90 112.30
AUD/USD Current price: 0.7186
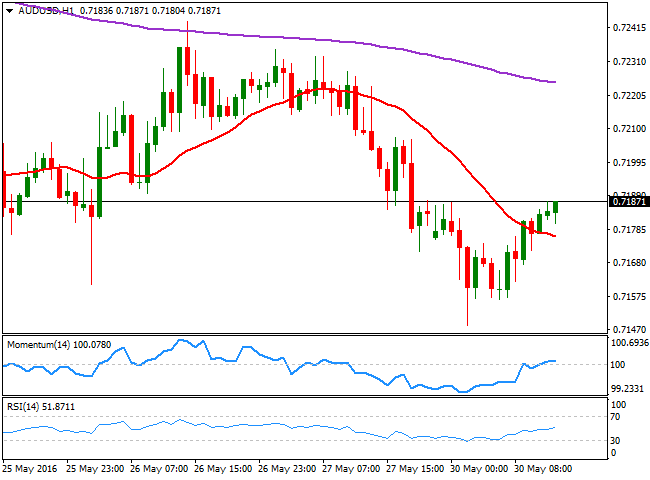
The AUD/USD pair enters positive territory mid European morning, having been as low as 0.7148 at the beginning of the day. Still trading below the 0.7200 level the 1 hour chart shows that the price advanced above its 20 SMA, but that the technical indicators lost upward momentum and turned flat around their mid-lines, reflecting little buying interest around the pair. In the 4 hours chart, the technical outlook is neutral-to-bearish, as the price is being capped by an horizontal 20 SMA whilst the technical indicators head south within negative territory. The multi-month low posted this May stands at 0.7145, and is the level to break to confirm additional declines during the upcoming sessions.
Support levels: 0.7145 0.7100 0.7065
Resistance levels: 0.7215 0.7250 0.7290


