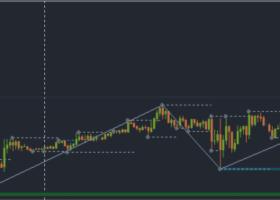
Chart: https://bi0l.blogspot.com/2016/05/usd-chf-intraday-forecast-technical.html
Estimated level:
Support (S1 / S2 / S3 = 0,98984 / 0,98893 / 0,98745), resistance (R1 / R2 / R3 = 0,99279 / 371/519).
Key resistance levels (1st from 0.99091 to 0.99104 in the late afternoon, 2nd from 0.99169 to 0.99124).
Indicator OsMa marked increase in activity bears, which is the basis for planning of trading operations for the correction of an advantage today.
Given the state of the Stochastics oscillator, test and forward (down H1), 2 key levels, and to reduce settlement support levels (S1, S2, S3), where it is recommended to consider the activities of the parties on the charts of smaller timeframes.
For short-term positions in sales is recommended to choose the level of formation of reversal signals (down H1, R1w, R1) with the objectives to (S1, S2, S3), and provided to the breakdown (S1 W1).
Alternative shopping correction, on condition of formation of reversal S1 with goals (down H1), as provided above breakdown to the calculated daily resistance levels (R1, R1 W1, R2).


