

In our latest update on ES-Mini, Will that Support Zone Hold?, we discussed the current complex structure that the market has created. It has traded in a downward channel around 2040-2070 levels.
ES-Mini 1h Chart - May 6, 2016
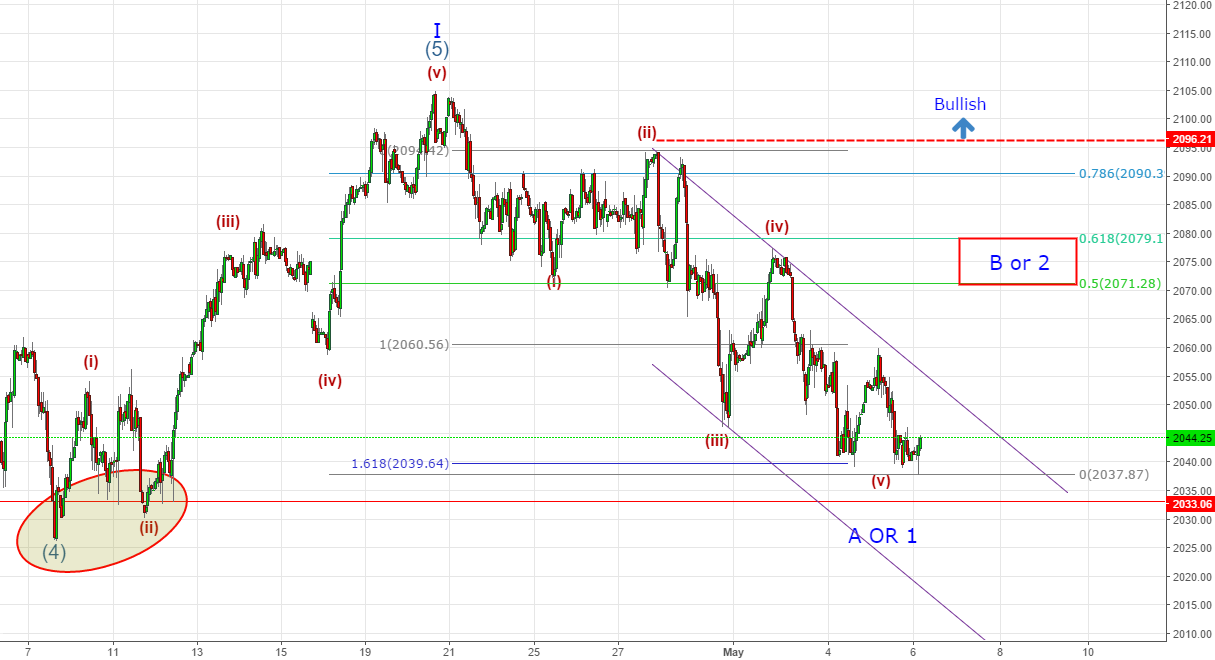
In this chart, we can see that 5-waves down from the top (wave (5)) are actually completed and price might bounce here rather than push it down towards the 2025-2030 price zone (lower-bound of the channel).
As we stated in our previous article, Will that Support Zone Hold?:
After this 5 waves down are completed, we expect 50%-62% retracements... Read More


