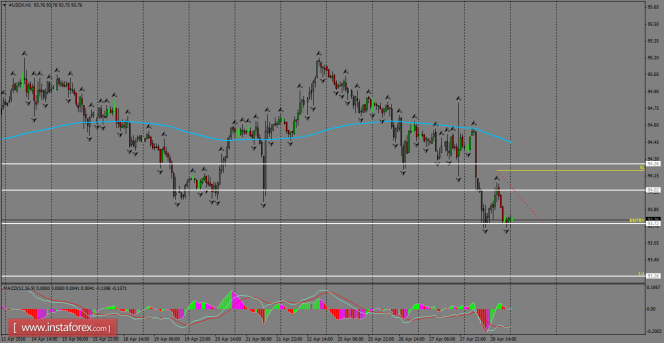
Daily Analysis of USDX for May 02, 2016
We could be in front of a possible double bottom pattern on the H1 chart, where the USDX is finding strong support around the 93.72 level. However, this corrective move may be taken as a possible lower low pattern formation in order to extend the decline to reach new lows. If a breakout happens below the 93.72 zone, then the price can fall to the 93.26 level.

H1 chart's resistance levels: 94.02 / 94.26
H1 chart's support levels: 93.72 / 93.26
Trading recommendations for today:
Based on the H1 chart, place buy (long) orders only if the USD Index breaks with a bullish candlestick; the resistance level is at 93.72, take profit is at 93.26, and stop loss is at 94.20.


