Daily Analysis of GBP/USD for April 25, 2016
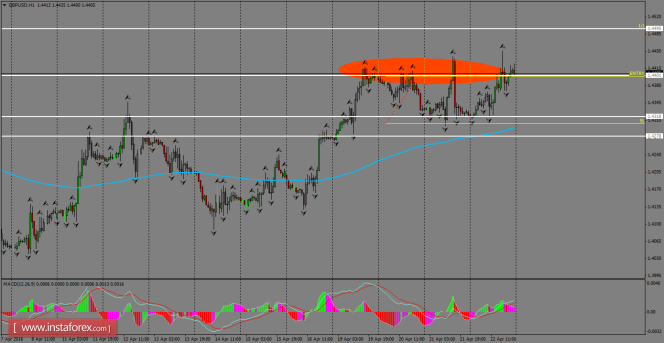
The Cable is trying to break a key supply zone in the upside trend, as it has been trading above the support level of 1.4318, which served as a strong bottom in a short-term basis. However, during this week, there will be a huge challenge for the buyers, as the 1.4400 psychological zone is solid and if GBP/USD succeeds in breaking that level, then it could rally to the 1.4495 level.

H1 chart's resistance levels: 1.4401 / 1.4495
H1 chart's support levels: 1.4318 / 1.4278
Trading recommendations for today:
Based on the H1 chart, place buy (long) orders only if the GBP/USD pair breaks a bullish candlestick; the resistance level is at 1.4401, take profit is at 1.4495 and stop loss is at 1.4303.
The material has been provided by InstaForex Company - www.instaforex.com


