Technical Analysis of Gold for April 15, 2016
Gold is still trading above the $1,190-$1,200 support but bulls also do not show enough strength signs for a move towards $1,300. As long as it trades above $1,190, the price still has some hopes of reaching a new high. However I prefer to be neutral or bearish waiting for $1,150.

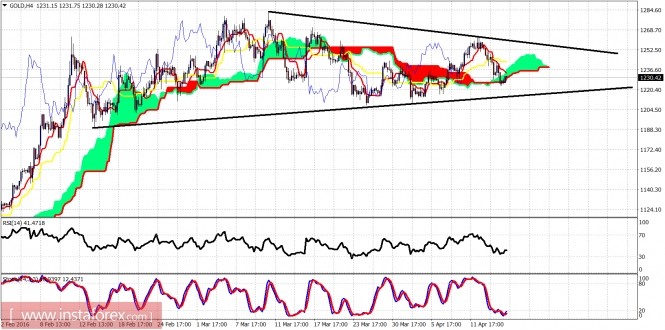
Black lines - triangle pattern
Gold, as expected by our latest analysis, bounced towards the $1,240-45 area but once again got rejected and made new lower lows towards cloud support at $1,224. For now, bulls manage to hold above or inside the 4-hour chart cloud. The trend is mainly sideways and the trading range is contracting.

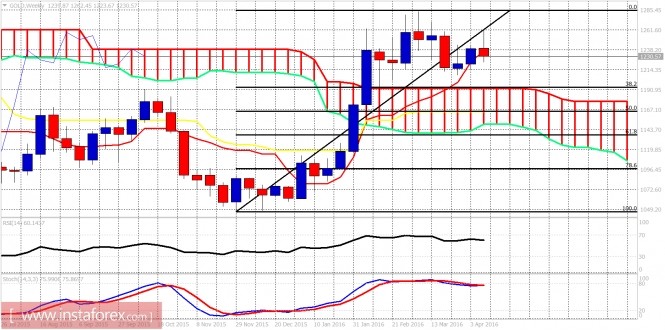
On the weekly chart, we should be very cautious and patient to wait and see where this week's candle closes. The tenkan-sen (red line indicator) support is being tested. The stochastic is overbought and turning lower. I believe there are more chances to see a downward move than a new high above $1,283. However, I remain longer-term bullish in Gold and expect a deep pullback below $1,180 towards $1,140-50 in order to re-open long positions. Until then, I prefer to be neutral or slightly bearish.
The material has been provided by InstaForex Company - www.instaforex.com


